
Learn Center
Retail Trend Navigator
Three stacked charts for one ticker, each with a Short MA, a Long MA and BUY and SELL crossover labels, so you can see whether the trend agrees across timeframes.
What is a moving average crossover signal, and how does EZPZ show it?
A moving average crossover signal fires when a faster moving average crosses a slower one. Faster above slower is a BUY, faster below slower is a SELL. The EZPZ Retail Trend Navigator draws that idea on three stacked charts for one ticker, Short-Term, Intermediate-Term and Long-Term, so you can see whether the trend agrees across horizons.
Each chart plots the ticker's closing price as a white line with a Short MA and a Long MA on top. Where the Short MA crosses above the Long MA, the chart drops a green BUY label. Where it crosses below, it drops a red SELL label. The three charts run at different speeds, so the top one reacts quickly, the middle one smooths out noise, and the bottom one only turns when the dominant trend does. That is the point of the page. A single crossover can look convincing on its own and still be a bounce inside a bigger downtrend, or a dip inside a bigger uptrend. Reading three charts together tells you which one you are looking at. The markers are historical labels on the chart, not alerts, and the page does not publish the moving average lengths behind them.
How the Retail Trend Navigator works on EZPZ
The page opens on SPY with the Daily frequency. A header card shows the ticker with its current price (SPY $766.62 in the capture), then a frequency dropdown, a ticker search box and a Go button. Below it, three chart cards are stacked in a fixed order: Short-Term Trend, Intermediate-Term Trend and Long-Term Trend. A short guide at the bottom repeats the BUY and SELL rules for each chart.
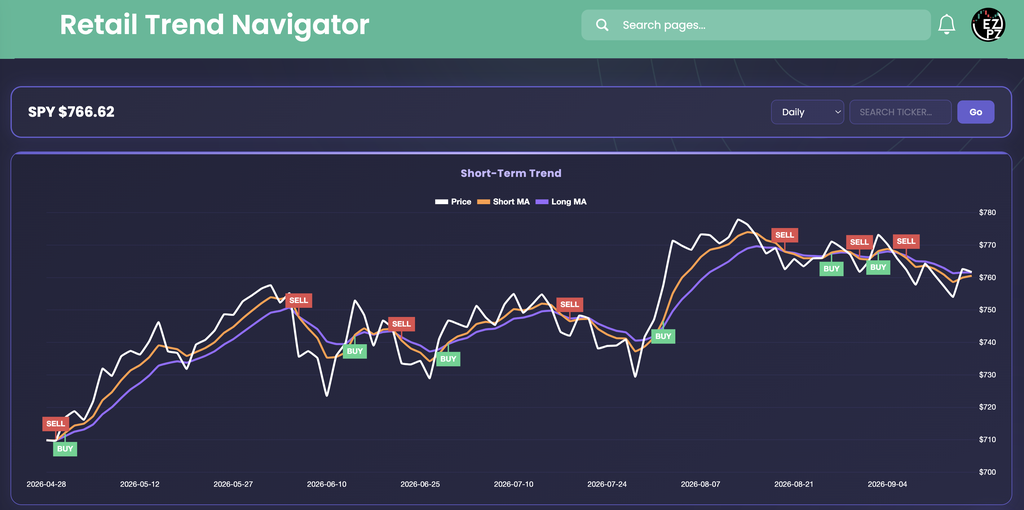
In the capture the Short-Term chart runs from 2026-04-28 to mid September and shows how twitchy a fast crossover is. One BUY lands near the end of July at the base of the rally toward $778 in early August, which is the kind of turn the chart is built to catch. From late August through mid September the price stays inside a roughly $20 range and the chart prints five alternating SELL and BUY labels in a row. That cluster is the classic whipsaw: the two lines keep crossing because there is no trend to follow. The last marker on the chart is a SELL, and the Short MA sits just under the Long MA at the right edge.

The Intermediate-Term chart tells a calmer story on the same days. Its Short MA stays above its Long MA for the whole window, so there is no new crossover label after the opening pair. The tooltip on 2026-09-11 reads Price $764.29, Short MA $765.01 and Long MA $758.93. The Short MA is $6.08 above the Long MA, and price has slipped just under the Short MA while both lines still slope up. That reads as a pullback inside an uptrend, not a reversal.

On the Long-Term chart the Short MA reads about $759 and the Long MA about $737 at the right edge, and the gap has widened for months. Price stays above both. With all three charts in view, the picture for SPY in this capture is a long and intermediate uptrend with a fast chart that has gone choppy and just flipped to a SELL. That is a mixed read, and the mix is the information.
How the Retail Trend Navigator differs from the rest of stocks-strategies
Retail Trend Navigator is a one-ticker chart page that reads trend from moving average crossovers at three speeds. It does not rank anything and it does not score anything. Market Trend Signals is the sibling trend page that compares price with key moving averages. Trend Trading Strategy is a members reading page on risk to reward, ATR stops and regime, with no chart. Stocks Outperforming and Relative Strength (RS) Ranking compare many stocks against SPY, while this page looks at one symbol against its own averages. Weighted Alpha and Historical Weighted Alpha boil a year of trend into a recency weighted number. Volatility Deviations flags moves that stretched past a stock's normal range. WarriorTrading Setup is a low float day trading setup and Peter Lynch Fundamental Screener is a valuation screen.
Related pages in other categories: Technical Analysis reads one ticker's indicator gauges, Top-50 Aggregate Technicals summarizes a group, and Market Price Action Trend stacks the market chart over a ticker chart. When a name is worth more time, Ticker Explorer is the one-symbol dashboard.
Reading the three charts
The three cards share the same layout, but each has its own pair of lines. Every card lists Price, Short MA and Long MA in its own legend at the top.
| Chart | What it is for | How to read it |
|---|---|---|
| Short-Term Trend | The fastest crossover pair. Best for spotting an early shift in momentum. | Expect the most labels here. A cluster of alternating BUY and SELL labels in a tight price range means the trend is unclear, not that a move is starting. |
| Intermediate-Term Trend | A middle speed pair that filters out a lot of the short-term noise. | A new label here is a more meaningful change than one on the Short-Term chart. Use it to judge whether a short-term flip has support. |
| Long-Term Trend | The slowest pair. Shows the dominant multi-period trend. | Labels are rare. When the Short MA sits well above the Long MA and the gap keeps widening, the trend is established. When it does flip, it is a bigger event. |
Working the page
- Ticker: type a symbol in Search ticker and press Enter or click Go. All three charts and the price in the header switch together. The page opens on SPY.
- Frequency: the dropdown offers Daily, Weekly, Monthly, Quarterly and Yearly. Daily is the default. Go longer to judge the structural trend and stay on Daily for near-term timing.
- Hover: move over any chart to see a tooltip with the date, Price, Short MA and Long MA.
- Refresh: the page reloads its data on its own about once a minute, so you do not need to refresh the tab.
- Ask AiPe: AiPe sees the ticker, price, interval and the state of all three charts. It can switch the ticker or the frequency if you ask, and it will read the timeframes back to you. It will not explain the moving average lengths, because those are not disclosed.
How people actually use it
Check for alignment
Look at all three charts before acting on any one label. A Short MA above the Long MA on all three is a broad uptrend. Two up and one down is a mixed read.
Tell a bounce from a reversal
A fresh BUY on the Short-Term chart while the Long-Term Short MA is still under its Long MA is usually a bounce inside a downtrend. A reversal shows up on the slower charts too, eventually.
Spot a choppy market
Many labels close together on the Short-Term chart mean the lines are whipsawing. Wait for a trend before trusting them, or lean on the slower charts.
Zoom out with frequency
Switch to Weekly or Monthly to see whether a Daily signal fits the larger structure, then go back to Daily to time the entry.