
Learn Center
Volatility Risk Premium (VRP)
The gap between what options implied volatility predicts and what a stock's volatility actually turns out to be, and why that gap has historically tended to favor option sellers.
What is volatility risk premium?
Volatility risk premium is the gap between implied volatility and later realized volatility on the same ticker. On EZPZ, Volatility Risk Premium (VRP) is one searchable chart: Filter ticker, 30 Days, 60 Days, or 90 Days, then Go. Status is OVERVALUED IV or UNDERVALUED IV. It is not a buy or sell.
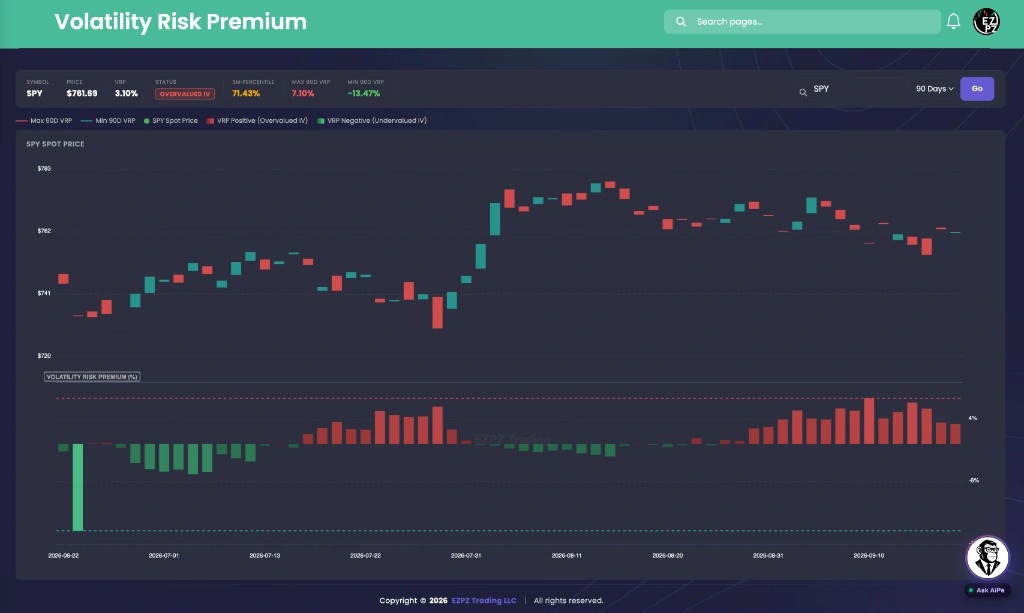
Implied volatility is the options market's forward estimate of how much a name will move. Realized volatility is how much it actually moved once that window has passed. A positive VRP means implied volatility ran ahead of later realized moves, which often lines up with richer option prices. A negative VRP means the stock moved more than options priced. On EZPZ, the live page title is Volatility Risk Premium. The header bar prints Symbol, Price, VRP, Status, 3M Percentile, then Max and Min VRP for the lookback you picked. Placeholder is Filter ticker. The days menu starts on 30 Days. Choices are 30 Days, 60 Days, and 90 Days. Go loads the name. The screenshot uses SPY with 90 Days, OVERVALUED IV, and 3M Percentile at 71.43%. The chart title is SPY Spot Price. The divider is VOLATILITY RISK PREMIUM (%). Candles sit on top. Red bars are VRP Positive. Green bars are VRP Negative. AiPe in the corner is labeled VRP Analyst. Status is a label, not a fill.
On EZPZ, this page is implied versus later realized on one ticker you search. Theta Farming is the universe scanner with Fit Score. Theta Performance tracks Seller P&L % on one ticker and prints a VRP badge on that card. Custom Strategies is the payoff builder you assemble. Directional Options Pressure is Chart View and Table View for Short Straddle, Short Strangle (Δ20), Directional Pressure, and Net Volume. Greek Gods Dashboard is Ares, Hermes, Apollo, and Zeus on SPY Dashboard or SPX Dashboard. Contract Prices (XVWAP) is Price candles against XVWAP on one strike. IV Rank Explorer is Current IV (30D) and IV Rank (1Y) for one ticker you search. Historical Volatility is 10D through 90D Volatility versus Price, not VRP. Volatility Analysis is Volatility By Open Interest, Open Interest, and Implied Volatility Smile. Expected Move is DEM and VEM bands by expiration. Ticker Explorer is the one-symbol dashboard after you already picked a name. Option Chain is the listed book, where implied volatility sits on a contract row. Gamma Short Squeeze is Squeeze Score(%) ranks.
How Volatility Risk Premium works on EZPZ
Type a ticker in Filter ticker, leave 30 Days on, then press Go. It is not a score. Most people start with Status and VRP. If Status is OVERVALUED IV, read 3M Percentile next to Max and Min VRP for that lookback. Switch to 60 Days or 90 Days when you want a longer window. Do not treat SPY as a default thesis.
How this differs from Theta Farming
Theta Farming is a universe scan. Fit Score sits on Strategy Suggestion badges across many names. This page is one ticker at a time. VRP, Status, and 3M Percentile sit on the header, not on a Fit Score column. Use Theta Farming when you want Iron Condor or Covered Call next to Fit Score on a list. Use this page when you already have a name and want OVERVALUED IV or UNDERVALUED IV next to the spot candles. Use Theta Performance when you want Seller P&L % or Payoff at Expiration. That page can print a VRP badge. It is not this combined chart. Use Custom Strategies when you want a payoff diagram. Use Directional Options Pressure when you want Straddle Profit % next to Directional Pressure. Use IV Rank Explorer when you want Current IV (30D) and IV Rank (1Y). Rank is where implied volatility sits versus that ticker's own high and low. VRP compares implied with later realized. Use Historical Volatility when you want 10D through 90D versus Price. Use Volatility Analysis when you want IV by strike. Use Expected Move when you want DEM versus VEM. Use Ticker Explorer when you want quote, IV Rank, and unusual activity on one symbol. Use Option Chain when you want listed strikes.
Anatomy of the header and chart
You do not need every pill on every session. Use the tabs if you want a map of the fields.
The left side of the header is Symbol, Price, VRP, Status, 3M Percentile, Max VRP, and Min VRP.
| On the page | What you are looking at |
|---|---|
| Symbol | The ticker you loaded. The screenshot prints SPY. |
| Price | Latest close on the loaded name. The screenshot prints $761.89. |
| VRP | Latest volatility risk premium as a percent. The screenshot prints 3.10%. |
| Status | OVERVALUED IV or UNDERVALUED IV. The legend maps those to VRP Positive and VRP Negative. The screenshot prints OVERVALUED IV. |
| 3M Percentile | Where latest VRP sits versus the recent three-month window. The screenshot prints 71.43%. |
| Max 30D VRP Min 30D VRP | High and low VRP inside the lookback you picked. The labels become Max 60D VRP and Min 60D VRP, or Max 90D VRP and Min 90D VRP, when you change days. The screenshot uses 90 Days and prints 7.10% and -13.47%. |
The legend sits under the header. Max and Min labels follow the days menu.
| On the page | What you are looking at |
|---|---|
| Max 30D VRP | Red dashed line on the VRP pane. The screenshot uses 90 Days, so the label is Max 90D VRP. |
| Min 30D VRP | Teal dashed line on the VRP pane. The screenshot label is Min 90D VRP. |
| SPY Spot Price | The candles. The label uses the ticker you loaded, then Spot Price. |
| VRP Positive (Overvalued IV) | Red bars. Implied volatility ran ahead of later realized moves on that date. |
| VRP Negative (Undervalued IV) | Green bars. The stock moved more than options priced on that date. |
One combined chart. Spot candles sit on top. VRP bars sit under the VOLATILITY RISK PREMIUM (%) divider.
| On the chart | What you are looking at |
|---|---|
| SPY Spot Price | The chart title. It follows the ticker. Hover a candle for O, H, L, and C. |
| VOLATILITY RISK PREMIUM (%) | The divider on the lower pane. Hover a bar for VRP as a percent. |
| Left axis | Spot dollars on the candle pane. |
| Right axis | VRP percent on the bar pane. |
Controls on this page
This page is ticker search plus a days menu. There is no strategy tab and no Fit Score. Do not treat the days menu as a score.
| Control | What you are looking at |
|---|---|
| Filter ticker | Search box. Type a symbol. It forces uppercase as you type. Enter loads the name. |
| 30 Days 60 Days 90 Days | Lookback. Starts on 30 Days. Changing it reloads the chart. The screenshot uses 90 Days. |
| Go | Loads Filter ticker and the selected days. |
How people actually use it
Check one name
Type a ticker already on your radar. Read Status and VRP first. Then look at 3M Percentile next to Max and Min VRP.
Change the window
Leave 30 Days on for the shortest clock. Switch to 60 Days or 90 Days when you want Max and Min VRP on a longer lookback.
Read bars with candles
Hover a date. Match the candle's O, H, L, and C with the VRP bar. A stretch of red bars under a quiet candle range is still history, not a setup.
Use it next to the other clocks
Keep this page beside IV Rank Explorer and Historical Volatility. Rank, realized windows, and VRP are three different jobs. Then open Theta Farming if you want a scanner.