
Learn Center
Exchange Volume
A per stock breakdown of where trading volume is actually executing across individual exchanges and off exchange venues.
What is one-ticker exchange venue mix?
One-ticker exchange venue mix is that stock's share of volume by reporting venue, including Off Exchange next to lit exchanges. On EZPZ it is Exchange Volume. Active Symbol starts on AAPL. Each row is one Exchange with Day %, 30D %, Increase %, Volume, Avg Volume (30D), and Premium. It is a venue mix, not a short sale table.
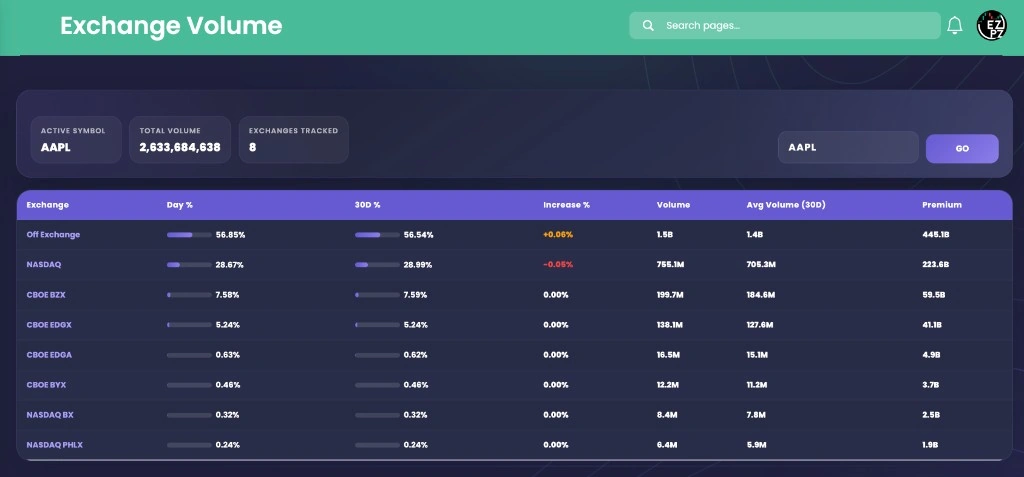
Day % is that venue's share of the loaded ticker's volume on this load, printed as a bar and percent. 30D % is that venue's 30 day average share, printed the same way. Increase % is Day % versus the prior session's share. Volume is share count. Avg Volume (30D) is the 30 day average share count. Premium is dollar volume on that venue. The screenshot starts on AAPL. Active Symbol is AAPL. Total Volume is 2,633,684,638. Exchanges Tracked is 8. Off Exchange prints 56.85% Day % against 56.54% 30D % and +0.06% Increase %, with 1.5B Volume, 1.4B Avg Volume (30D), and 446.1B Premium. NASDAQ prints 28.67% Day % against 28.99% 30D % and -0.05% Increase %, with 755.1M Volume. CBOE BZX prints 7.58%. CBOE EDGX prints 5.24%. CBOE EDGA prints 0.63%. CBOE BYX prints 0.46%. NASDAQ BX prints 0.32%. NASDAQ PHLX prints 0.24%. Rows sort by Volume, largest first. A +0.06% Increase % on Off Exchange is not a squeeze.
On EZPZ, the live page title is Exchange Volume. Active Symbol, Total Volume, and Exchanges Tracked sit on the first card. The ticker field and GO sit on the right. Click a Ticker on Exchange Volume Leaderboard to open this page. Exchange Volume Leaderboard ranks Off Exchange next to Nasdaq and Cboe across many names. Short Volume is daily short-sale share of volume, not Day %. Short Volume Trends charts that daily percent over time. Short Interest is the one-ticker official snapshot. Short Interest Leaderboard ranks Official Short Interest %. ShortEx is the squeeze focused rank that blends short interest with days to cover and short volume. Gamma Short Squeeze is Squeeze Score(%) next to Gamma Pressure and Short Interest(%). Ticker Explorer is the one-symbol dashboard after you already picked a name.
How Exchange Volume works on EZPZ
Type a ticker, then GO. The page starts on AAPL if the URL has no symbol. Read Off Exchange against NASDAQ, the CBOE rows, and Premium on the same load. It is not a score you trade. Compare Day % to 30D % when one session looks noisy. Open Increase % when you want the move versus the prior session. Do not treat AAPL as a default thesis.
How this differs from Exchange Volume Leaderboard
Exchange Volume Leaderboard ranks many names at once. Alphabetical starts on. This page is one ticker you already have in mind. Use the leaderboard when you want Off Exchange next to Nasdaq and Cboe across the market. Use this page when you want Day %, 30D %, Increase %, Volume, Avg Volume (30D), and Premium for one symbol. Short Volume ranks daily Short Volume versus Total Volume. Its starting tab is High Short Sale Volume. This table does not print Percent for short sales. Use Short Volume when you want that tape share. Use this page when you want venue Day %. Short Volume Trends charts that daily percent after you click a Ticker on Short Volume. Short Interest is Official Short Interest (% Float) and Historical Data. This table does not print that official percent. Short Interest Leaderboard ranks Official Short Interest %. Its sliders start at Official Short Interest Above 8%, Market Cap Above 5M, and Average Volume Above 1M. This page has none of those sliders. ShortEx ranks Short Score. This table does not print Short Score. Gamma Short Squeeze is Squeeze Score(%) next to Gamma Pressure. Use that page when you want options gamma on the same row as Short Interest(%). Use this page when you want Exchange, Day %, 30D %, and Increase %. Use Ticker Explorer after you already picked a symbol.
Active Symbol, GO, and the hero totals
Active Symbol, Total Volume, and Exchanges Tracked sit on the hero card. The ticker field and GO sit on the right. There is no Apply button. Enter reloads the same way GO does. The URL keeps symbol, so a Ticker link from Exchange Volume Leaderboard can land on the same name.
| Control | What it does |
|---|---|
| Active Symbol | The loaded ticker. The screenshot prints AAPL. The page starts on AAPL. |
| Total Volume | Share volume across the venues on this load, with commas. The screenshot prints 2,633,684,638. |
| Exchanges Tracked | How many venue rows loaded. The screenshot prints 8. |
| ticker field | The unlabeled box next to GO. The placeholder is Enter symbol. The field is uppercase. Letters and a dot are allowed. |
| GO | Loads that ticker. Enter in the ticker field does the same. |
Anatomy of a venue row
Read a row left to right: Exchange, then Day % against 30D %, then Increase %, then Volume against Avg Volume (30D), then Premium. You do not need every column on every venue. The screenshot starts at Off Exchange with 56.85% Day % and 1.5B Volume. Rows sort by Volume, largest first. There is no page bar.
These columns answer where that ticker's volume printed on this load.
| Column | What you are looking at |
|---|---|
| Exchange | The venue name. The screenshot starts at Off Exchange, then NASDAQ, CBOE BZX, CBOE EDGX, CBOE EDGA, CBOE BYX, NASDAQ BX, and NASDAQ PHLX. |
| Day % | That venue's share of this load, shown as a bar and percent. The screenshot prints 56.85% on Off Exchange and 28.67% on NASDAQ. |
| 30D % | That venue's 30 day average share, shown the same way. The screenshot prints 56.54% on Off Exchange and 28.99% on NASDAQ. |
| Increase % | How Day % moved versus the prior session. A plus sign is orange. A minus sign is red. The screenshot prints +0.06% on Off Exchange and -0.05% on NASDAQ. |
These columns help you size the venue against its own 30 day average.
| Column | What you are looking at |
|---|---|
| Volume | Share count on that venue. The screenshot prints 1.5B on Off Exchange, 755.1M on NASDAQ, and 199.7M on CBOE BZX. |
| Avg Volume (30D) | That venue's 30 day average share count. The screenshot prints 1.4B on Off Exchange and 706.3M on NASDAQ. |
| Premium | Dollar volume on that venue. The screenshot prints 446.1B on Off Exchange, 223.6B on NASDAQ, and 59.5B on CBOE BZX. |
How people actually use it
Start on Off Exchange
Leave the Volume sort first. Then read Day % against 30D %. On this AAPL load that puts Off Exchange at 56.85% versus 56.54%, with 1.5B Volume.
Read Increase % when one session looks noisy
Orange plus means Day % rose versus the prior session. Red minus means it fell. On this load NASDAQ prints -0.05% next to 755.1M Volume.
Open it from the many-name board
Click a Ticker on Exchange Volume Leaderboard. Use that table for many names. Use this page when you want Day % and 30D % for one symbol.
Pair it with shorts, not instead of them
Use Short Volume when you want short-sale Percent. Use Short Interest or ShortEx when you want Official Short Interest % or Short Score.