
Learn Center
Congressional Trading
Stock trades made by members of Congress, made public because federal law requires them to disclose it.
What is congressional stock trading data and how do you read it?
Congressional stock trading data is the public record of stock purchases and sales that members of Congress, along with their spouses and dependent children, must disclose under the STOCK Act. On EZPZ, the Congressional Trading page turns those filings into four views: an Overview of the most active Democrats and Republicans, a full Politician ranking, a searchable Trades list, and a Last 60 Day Trades tab.
Read it as a look back, not a live feed. The law gives filers up to 45 days after a trade to report it, so every row describes something that already happened, and the Date column is the trade date, not the day the filing appeared. Amounts are never exact. Filers report a dollar range, and EZPZ shows the range in the Note column and the middle of that range in Transaction Amount. A filing also says nothing about why someone traded. It can be a rebalance, a spouse's account, or a manager acting without asking. Use the page to see who trades often, which tickers show up, and how large the reported ranges are, then check the price chart and the news before you make anything of a single row.
How the Congressional Trading page works on EZPZ
Four tabs run across the top, and the page loads without a login. Logged-out and free-plan visitors see a yellow Delayed banner with a link to join free. The list is the same either way.
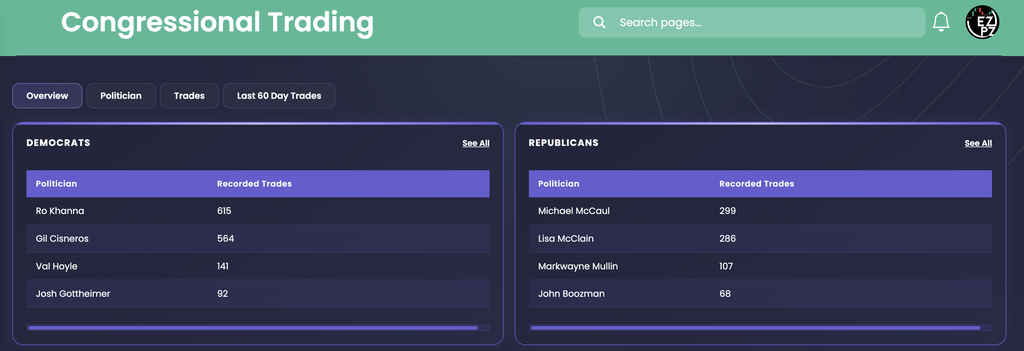
The Overview is the landing tab. It shows the two party cards first and the full All Trades table under them.
The Overview tab: Democrats and Republicans cards
Each card has two columns and a See All link that opens the Politician tab in a new window.
| Column | What you are looking at |
|---|---|
| Politician | The member's name. Click it to open the Trades tab filtered to that person, in a new window. |
| Recorded Trades | How many disclosed trades EZPZ has on file for that person. It is a running total, so it does not change when you change the date range or any filter. |
In the capture, the Democrats card leads with Ro Khanna at 615 and Gil Cisneros at 564, then Val Hoyle at 141 and Josh Gottheimer at 92. On the Republicans card Michael McCaul reads 299, Lisa McClain 286, Markwayne Mullin 107, and John Boozman 68. Each card shows only four names. When two people tie, the shorter card cuts one of them off: Julia Letlow also has 68 trades, but only John Boozman fits on the Republicans card. The Politician tab has both.
The All Trades table and its search bar

The search bar has five controls, and the table updates only when you click Search.
| Control | How it behaves |
|---|---|
| e.g., AAPL | A ticker. It matches the whole symbol, in any letter case, so AAPL will not return other tickers that start the same way. |
| Politician | Part of a name is enough, in any letter case. "Gott" finds Josh Gottheimer. |
| From and To dates | The trade date range, inclusive. The page opens with the last 60 days filled in. The boxes follow your browser's date format, so the capture reads day first. |
| All Type | A dropdown with All Type, Buy, Sell, and Exchange. |
The table lists 25 trades per page, newest first, with page controls under it. Its columns are below.
| Column | What you are looking at |
|---|---|
| Ticker | The symbol traded. Click it to open the Trades tab filtered to that ticker, in a new window. |
| Politician | The filer's name, also a link to their trades. |
| Chamber | Chamber and party in one cell, such as house | Democrat. When the party is blank the cell ends at the bar, as in house |. |
| Date | The transaction date, year first. |
| Transaction Amount | The middle of the reported range, dropped to a whole dollar and printed with no comma. It is an estimate of size, not what was actually paid. |
| Type | Buy in green, Sell in red, and any other type such as Exchange in white. |
| Note | The reported range, written as "Traded $1000 to $15000." It is built from the range, not free text from the filing. |
The middle-of-range rule is easy to check. Tim Walberg's Sell of FSSL on 2026-06-01 reads $32500 beside a Note of $15001 to $50000, and Josh Gottheimer's Buy of MSFT on 2026-05-19 reads $750000 beside $500001 to $1000000. The actual trade could sit anywhere inside its range.
Reading the trades in the capture
Josh Gottheimer's rows from 2026-05-19 to 2026-05-27 make a good exercise. There are four Buys (ADI and MSFT on 05-19, MU on 05-21, LITE on 05-22) and two Sells (INTU on 05-22, ABT on 05-27). Every row but MSFT carries a range of $1000 to $15000 and reads $8000. The MSFT row is the outlier, with a $500001 to $1000000 range and $750000 in Transaction Amount. Add the six rows up and that one trade dominates the dollars, even though it is one of six. Count trades and look at the ranges separately.
Three names in the same capture, Christian Menefee, Jake Auchincloss, and David Taylor, show house | with nothing after the bar. Their party is blank in the data, so they will not appear on the party cards or the Politician tab, although their trades are all in the table.
The Politician tab

This is the Overview cards without the four-name cut. Two tables sit side by side, Democrats on the left and Republicans on the right, each with Politician and Recorded Trades, sorted from most to fewest. Names link to the Trades tab the same way. The capture shows the Democrats list running from Ro Khanna at 615 down to Ed Case at 3, with Nancy Pelosi and Sheldon Whitehouse level at 18. The Republicans list runs from Michael McCaul at 299 down to Brian Babin at 7, with Julia Letlow and John Boozman level at 68. Both lists continue below the capture, so scroll to see the rest.
Only Democrats and Republicans are listed. A politician whose party is blank, or is neither of the two, appears in the All Trades table but not here.
The Trades tab

This tab is the All Trades table on its own, with the same search bar, the same columns, and the same 25 rows per page. It is where every ticker and politician link on the site lands.
The Last 60 Day Trades tab
This tab looks only at the trailing 60 days, counted back from today. It ignores the date boxes on the other tabs. It has three parts.
| Part | What you are looking at |
|---|---|
| Buy / Sell Transactions, Last 60 Days chart | One pair of bars per trade date. Green bars above zero add up the Transaction Amount of that day's Buys. Red bars below zero add up that day's Sells. Hover a bar for the compact figure. Exchange trades are left off the chart. |
| Highest Number of Trades (60 Days) | Columns: Politician, Chamber (chamber and party), Nbr of Trades, Buy, Sell. Sorted by Nbr of Trades, highest first. Buy and Sell are counts, in green and red, so they can add up to less than Nbr of Trades when the rest are Exchange or another type. |
| Highest Trade Value (60 Days) | Columns: Politician, Chamber, Total Value, Buy, Sell. Sorted by Total Value, highest first. Total Value tracks the size of a politician's largest single trade in the window, so do not add it up as a dollar total. Buy and Sell are trade counts again. |
Neither table has a page control, so scroll down for the full list. Because bar heights use the middle of each range, a tall bar can come from one large-range trade. Cross-check against the Nbr of Trades table before you read a spike as a wave of buying.
How Congressional Trading differs from nearby Investing pages
This page answers "what have lawmakers disclosed trading?" The neighboring Investing pages cover other groups and other questions. Recommendation Trends counts how many analysts rate a stock Strong Buy through Strong Sell each month, and Upgrade and Downgrade lists each firm's rating change with the date. Social Sentiment measures the retail conversation, and Ticker Performance shows what the price did, so you can line up a disclosed trade against the returns and moving averages around it. Price Target shows where analysts expect the price to go, and Support and Resistance marks price levels where the stock has stalled before. When a ticker in the list catches your eye, Company News, Market News and Earnings Surprises are the first places to look for a reason around the trade date. Company Profile tells you what the business does. Sector Metrics shows the Actual and Median for each financial metric by sector, useful for judging whether a disclosed stock looks typical for its group. Financial Statements shows the reported revenue, profit, debt and cash, useful context before you weigh a disclosed trade. For the standard fundamental ratios behind the company, Basic Financials groups valuation, profitability, growth, debt, and dividends for one ticker. Historical Market Cap charts a company's total value across a date range, useful for seeing how the company's size moved around a disclosed trade. Dividends lists the cash a company pays out, a payout record that sits beside a disclosed trade. Analyst Estimates shows the revenue, EPS, EBITDA and EBIT forecasts analysts hold for the company, an expectations view that sits beside a disclosed trade.
Outside this category, Ticker Explorer is the one-symbol dashboard when you want a live quote and options context beside a name you found here.
What to check before you rely on it
- The date, not the headline. The Date column is the trade date. A filing can appear up to 45 days later, so the market may already have moved.
- The range, not the midpoint. Read the Note column. Transaction Amount is the middle of a range, and the real size can be anywhere inside it.
- Trades, not dollars. Recorded Trades and Nbr of Trades count rows. Compare ranges too.
- The window. A name from an Overview card opens on the last 60 days. Widen From to see the full history.
- The blank party. A cell like house | means the party is missing, not that the person is unaffiliated.
Who uses congressional trading data
Curious investors
See which lawmakers trade the most and which tickers they file on, without reading the raw disclosure forms.
Ticker researchers
Type a symbol into the search bar to see every disclosed trade in it, then check price and news around each date.
Pattern spotters
Use Last 60 Day Trades to see who has been most active lately and whether Buys or Sells dominate.
Journalists and students
Follow a politician's disclosures from the Politician tab into the Trades list, with the reported range on every row.