
Learn Center
Exchange Volume Leaderboard
A ranked view of stocks by how much of their trading volume executes away from the public exchanges rather than on them.
What is off exchange percent on an exchange volume leaderboard?
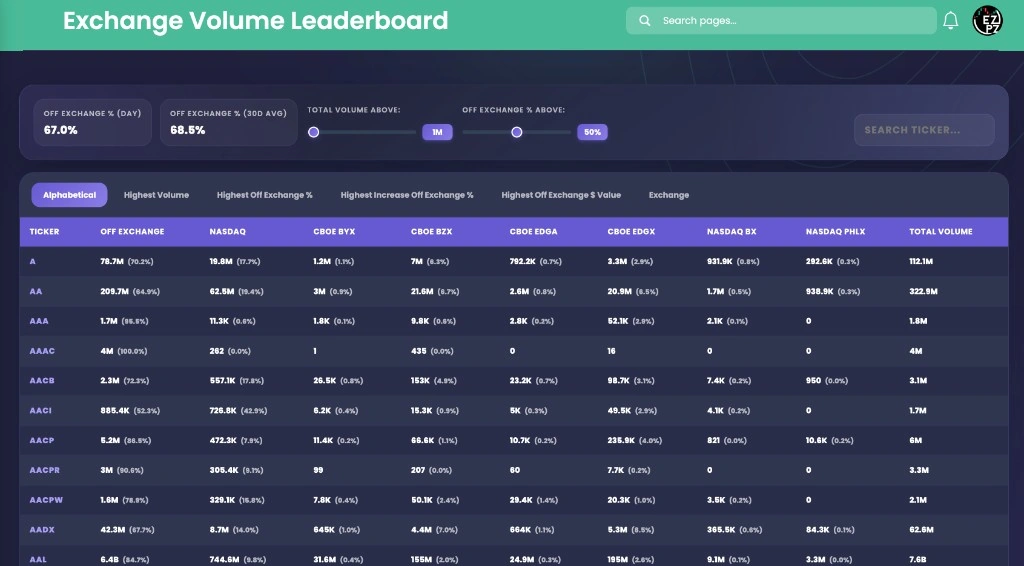
Off exchange percent is the share of a stock's volume that printed away from the lit public exchanges. On EZPZ it is the Exchange Volume Leaderboard. Alphabetical starts on. Each row is one Ticker with Off Exchange next to Nasdaq, Cboe, and Total Volume. It is a venue mix, not a short sale table.
Off Exchange is share volume printed away from the lit book, with that venue's percent in parentheses. Nasdaq, Cboe Byx, Cboe Bzx, Cboe Edga, Cboe Edgx, Nasdaq Bx, and Nasdaq Phlx sit on the same Alphabetical row. Total Volume is the sum. Off Exchange % (Day) sits at 67.0% on the screenshot. Off Exchange % (30D Avg) sits at 68.8%. Total Volume Above starts at 1M. Off Exchange % Above starts at 50%. Search ticker sits on the right. A prints 78.7M Off Exchange (70.3%) against 112.1M Total Volume. AA prints 209.7M (64.9%) against 322.9M. AAAC prints 4M (100.0%) against 4M. AAL prints 6.4B (84.7%) against 7.6B. Highest Volume keeps those venue columns. Highest Off Exchange % switches columns. Exchange is a venue board, not a ticker list. A 100% Off Exchange row is not a short squeeze.
On EZPZ, the live page title is Exchange Volume Leaderboard. Off Exchange % (Day), Off Exchange % (30D Avg), Total Volume Above, Off Exchange % Above, and Search ticker sit on the first card. Alphabetical starts purple. Highest Volume, Highest Off Exchange %, Highest Increase Off Exchange %, Highest Off Exchange $ Value, and Exchange sit next to it. Click a Ticker to open Exchange Volume. Exchange Volume is the venue mix for one ticker after you already picked a name. Short Volume is daily short-sale share of volume, not Off Exchange %. Short Volume Trends charts that daily percent over time. Short Interest is the one-ticker official snapshot. Short Interest Leaderboard ranks Official Short Interest %. ShortEx is the squeeze focused rank that blends short interest with days to cover and short volume. Gamma Short Squeeze is Squeeze Score(%) next to Gamma Pressure and Short Interest(%). Ticker Explorer is the one-symbol dashboard after you already picked a name.
How Exchange Volume Leaderboard works on EZPZ
Start on Alphabetical, then read Off Exchange against Nasdaq, the Cboe columns, and Total Volume on the same row. It is not a score you trade. Type a ticker in Search ticker when you already have a name. Move Total Volume Above or Off Exchange % Above when the list is too long. Open Highest Off Exchange % when you want the percent rank instead of A through Z. Do not treat AAL as a default thesis.
How this differs from Exchange Volume and Short Volume
Exchange Volume is one ticker you already have in mind. This page ranks many names at once. Use Exchange Volume when you want Day %, 30D %, and Average Volume (30D) for one symbol. Use this page when you want Off Exchange next to Nasdaq and Cboe across the market. Short Volume ranks daily Short Volume versus Total Volume. Its starting tab is High Short Sale Volume. This table does not print Percent for short sales. Use Short Volume when you want that tape share. Use this page when you want Off Exchange %. Short Volume Trends charts that daily percent after you click a Ticker on Short Volume. Short Interest is the official snapshot for one Symbol. Short Interest Leaderboard ranks Official Short Interest %. Its sliders start at Official Short Interest Above 8%, Market Cap Above 5M, and Average Volume Above 1M. This page starts at Total Volume Above 1M and Off Exchange % Above 50%. ShortEx ranks Short Score. This table does not print Short Score. Gamma Short Squeeze is Squeeze Score(%) next to Gamma Pressure. Use that page when you want options gamma on the same row as Short Interest(%). Use this page when you want Off Exchange, Nasdaq, Cboe, and Total Volume. Use Ticker Explorer after you already picked a symbol.
Hero stats, sliders, and Search ticker
Off Exchange % (Day), Off Exchange % (30D Avg), Total Volume Above, Off Exchange % Above, and Search ticker sit on the hero card. Search ticker reloads as you type. There is no Apply button. Total Volume Above and Off Exchange % Above reload as you move them. The Exchange tab hides those two sliders because that board is venues, not tickers.
| Control | What it does |
|---|---|
| Off Exchange % (Day) | Market wide off exchange share for the current load. The screenshot prints 67.0%. |
| Off Exchange % (30D Avg) | The 30 day average of that same market wide share. The screenshot prints 68.8%. |
| Total Volume Above | Keeps names at or above that Total Volume. Starts at 1M. The label prints M for millions. |
| Off Exchange % Above | Keeps names at or above that Off Exchange %. Starts at 50%. |
| Search ticker... | Jump to one ticker. The field is uppercase. Typing reloads. It is not Apply. |
Leaderboard tabs
The purple tab is the current list. Alphabetical starts on. The screenshot has that tab purple. Highest Volume keeps Off Exchange, Nasdaq, Cboe Byx, Cboe Bzx, Cboe Edga, Cboe Edgx, Nasdaq Bx, Nasdaq Phlx, and Total Volume. The other ticker tabs change columns. Exchange replaces the ticker table. Clicking a tab starts again on page 1.
| Tab | What sits at the top |
|---|---|
| Alphabetical | Tickers A through Z that still clear the sliders. This is the starting tab. The screenshot starts at A. |
| Highest Volume | Largest Total Volume. The venue columns stay the same. |
| Highest Off Exchange % | Largest Off Exchange %. Columns become Ticker, Off Exchange %, Off Exchange Vol, and Total Volume. |
| Highest Increase Off Exchange % | Largest rise versus Prev Day %. Columns add Off Exchange % Today, Increase, and 30D Avg %. |
| Highest Off Exchange $ Value | Largest Off Exchange $ Value. Columns add Off Exchange Vol and Off Exchange %. |
| Exchange | Venues, not tickers. Columns are Exchange, Day %, 30D %, Total Volume, and Average Volume (30D). The sliders hide. |
Anatomy of a leaderboard row
Read an Alphabetical row left to right: Ticker, then Off Exchange, then the lit venues, then Total Volume. You do not need Increase until Highest Increase Off Exchange % is on. The screenshot starts at A with 78.7M Off Exchange (70.3%) and 112.1M Total Volume. Prev and Next page 100 tickers at a time when the bar is showing.
These columns answer where that ticker's volume printed on Alphabetical and Highest Volume.
| Column | What you are looking at |
|---|---|
| Ticker | The symbol. Click it to open that name's Exchange Volume page. |
| Off Exchange | Share volume printed away from the lit exchanges, plus that share as a percent of Total Volume. The screenshot prints 78.7M (70.3%) on A and 4M (100.0%) on AAAC. |
| Nasdaq | Volume reported on Nasdaq. The screenshot prints 19.8M (17.7%) on A and 744.6M (9.8%) on AAL. |
| Cboe Byx Cboe Bzx | Volume on those Cboe venues. The screenshot prints 1.2M (1.1%) Cboe Byx and 7M (6.3%) Cboe Bzx on A. |
| Cboe Edga Cboe Edgx | Volume on those Cboe venues. The screenshot prints 792.2K (0.7%) Cboe Edga and 3.3M (2.8%) Cboe Edgx on A. |
| Nasdaq Bx Nasdaq Phlx | Volume on those Nasdaq venues. The screenshot prints 931.0K (0.8%) Nasdaq Bx and 292.6K (0.3%) Nasdaq Phlx on A. |
| Total Volume | The row total. The screenshot prints 112.1M on A, 322.9M on AA, and 7.6B on AAL. |
These columns replace the venue mix on Highest Off Exchange %, Highest Increase Off Exchange %, and Highest Off Exchange $ Value.
| Column | What you are looking at |
|---|---|
| Off Exchange % | Off Exchange as a share of Total Volume, shown as a bar and percent. This is the rank key on Highest Off Exchange %. |
| Off Exchange Vol | The Off Exchange share count without the lit venue split. |
| Off Exchange % Today | Today's Off Exchange % on Highest Increase Off Exchange %. |
| Prev Day % | Yesterday's Off Exchange % on that same increase tab. |
| Increase | How Off Exchange % moved versus Prev Day %. A plus sign means it rose. |
| 30D Avg % | That ticker's own 30 day average Off Exchange %. Compare it to Off Exchange % Today. |
| Off Exchange $ Value | Off Exchange volume in dollars. This is the rank key on Highest Off Exchange $ Value. |
These columns appear only on Exchange. There is no Ticker column.
| Column | What you are looking at |
|---|---|
| Exchange | The venue name for that row. |
| Day % | That venue's share of volume on this load, shown as a bar and percent. |
| 30D % | That venue's 30 day average share, shown the same way. |
| Total Volume | Share volume on that venue for the current load. |
| Average Volume (30D) | That venue's 30 day average share volume. |
How people actually use it
Start on Alphabetical
Leave the purple tab first. Then read Off Exchange against Total Volume. On this load that puts A at 70.3% and AAL at 84.7% with a much larger Total Volume.
Switch tabs when A through Z is the wrong sort
Highest Volume puts size first. Highest Off Exchange % puts the percent first. Highest Increase Off Exchange % adds Prev Day % and Increase when one session looks noisy.
Open the one-ticker mix
Click a Ticker to open Exchange Volume. Use this table for many names. Use that page when you want Day % and 30D % for one symbol.
Pair it with shorts, not instead of them
Use Short Volume when you want short-sale Percent. Use Short Interest Leaderboard or ShortEx when you want Official Short Interest % or Short Score.