
Learn Center
IPO Calendar
A month by month table of filed and priced IPOs with date, exchange, share count, price, status, and total offering size.
What is the IPO Calendar and how do you read it?
The IPO Calendar is a month by month table of companies that have filed to go public or have priced an offering, with the IPO date, exchange, share count, price, status, and total offering size for each. On EZPZ you pick a month with the tab row, then read each row from Symbol across to Total Shares Amount.
The column that separates a real listing from an early filing is Status. A row marked priced has an exchange, a share count, and a price, so you can check that shares times price equals the Total Shares Amount. A row marked filed usually has a dash for the exchange and zeros for shares and price, because those numbers are not set yet, but it still carries a Total Shares Amount. Read the table as a list of dates to plan around, not as a list of stocks to buy. A first day of trading can be fast and thin, and the calendar does not say how any price will behave. It is not a signal.
How the IPO Calendar works on EZPZ
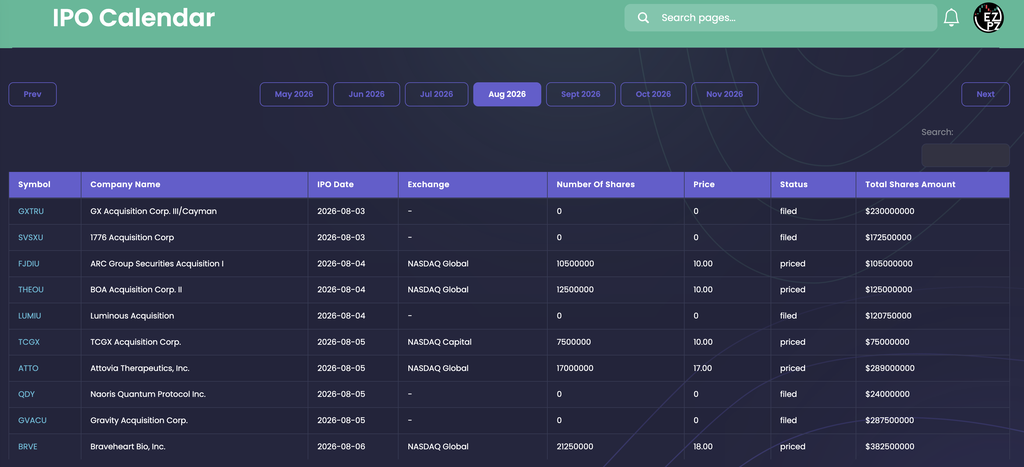
The page opens on the current month. Seven month tabs sit in a row with the selected month in the middle (Aug 2026 in the capture, with May through Nov beside it), and Prev and Next buttons slide the row by one month at a time. Each click loads that month's offerings into one table. The page gives you a range that starts two calendar years back and runs one year forward, so it works as both a look ahead and a record of recent listings.
The parts of the page
| Part | What you are looking at |
|---|---|
| Prev and Next | Slide the month row one month back or forward. The month that lands in the middle becomes the selected month and its rows load. |
| Month tabs | Seven tabs at a time, such as May 2026 to Nov 2026. The filled tab is the month on screen. Clicking a tab re-centers the row on it. |
| Search | A box above the table that filters the rows for the month on screen, across every column. It does not search other months. |
| Symbol | The ticker, in blue. It is a label only. It is not a link, so copy it into Ticker Explorer or your broker. |
| Company Name | The issuer's name as listed. |
| IPO Date | The date of the offering, written year, month, day. The table opens sorted by this column, earliest first. |
| Exchange | The listing venue, such as NASDAQ Global or NASDAQ Capital. A dash means none is listed yet. |
| Number Of Shares | Shares in the offering. It prints as a bare number with no commas, and 0 means no count is set. |
| Price | The offering price per share. 0 means no price is set. |
| Status | Where the deal stands. The capture shows filed and priced. The page does not define them. |
| Total Shares Amount | The total dollar size of the offering, printed with a leading $ and no commas. |
The table shows 10 rows per page and has no rows per page menu. If a month has more than ten offerings, page through them at the bottom of the table.
Reading the capture: filed versus priced
The capture is page 1 of August 2026 and shows ten rows dated 2026-08-03 through 2026-08-06. Five are priced and five are filed, and the two groups look very different.
| Symbol | Company | IPO Date | Exchange | Shares | Price | Status | Total |
|---|---|---|---|---|---|---|---|
| ATTO | Attovia Therapeutics, Inc. | 2026-08-05 | NASDAQ Global | 17,000,000 | 17.00 | priced | $289,000,000 |
| BRVE | Braveheart Bio, Inc. | 2026-08-06 | NASDAQ Global | 21,250,000 | 18.00 | priced | $382,500,000 |
| FJDIU | ARC Group Securities Acquisition I | 2026-08-04 | NASDAQ Global | 10,500,000 | 10.00 | priced | $105,000,000 |
| QDY | Naoris Quantum Protocol Inc. | 2026-08-05 | - | 0 | 0 | filed | $24,000,000 |
| GXTRU | GX Acquisition Corp. III/Cayman | 2026-08-03 | - | 0 | 0 | filed | $230,000,000 |
On every priced row the arithmetic closes. 17,000,000 shares at $17.00 is $289,000,000, 21,250,000 at $18.00 is $382,500,000, and 10,500,000 at $10.00 is $105,000,000. That is a quick check that a row is complete.
The filed rows show the opposite. QDY and GXTRU have no exchange, 0 shares, and a price of 0, yet each still prints a Total Shares Amount ($24,000,000 and $230,000,000). Shares times price would be zero, so on a filed row the total is the planned size, not a calculation you can rebuild. Treat it as a target that can change before the deal prices, and watch for the row to gain an exchange, a share count, and a price.
Seven of the ten names in the capture contain the word Acquisition, and several tickers end in U. Names like these are often blank check companies, which raise money first and pick a business to buy later, so their $10.00 price is a standard offering price and not a sign of a business you can analyze. Attovia, Braveheart Bio, and Naoris Quantum Protocol are the three operating company names on the page. The page does not label the type of issuer, so confirm it in the filing before you rely on that reading.
Ordering also matters. The table is sorted by IPO Date, earliest first, and rows that share a date (four fall on 2026-08-05) have no set order between them.
How to use the calendar in a trading week
- Start with Status. A priced row is a deal that has been set. A filed row is a heads up that can move, shrink, or slip.
- Check the completeness. An exchange, a share count, and a price should all be filled in before you treat a date as firm. Multiply shares by price and compare with Total Shares Amount.
- Use Search for a name. Type a ticker or part of a company name to jump to it inside the month on screen. Switch months first if you cannot find it.
- Look one month ahead. Click the next month tab to see what is filed but not yet priced, and come back closer to the date.
- After the debut, use the chart pages. Once a name trades, open Ticker Explorer for its flow and levels, and Company Profile for the IPO Date row and the company's basics.
How the IPO Calendar differs from nearby pages
This page is about new listings. The other Calendars pages track different kinds of dates. Economic Calendar lists scheduled data releases by country with Actual, Forecast, and Prior values, and Schedule lists EZPZ's own live sessions in your time zone, not market events. Earnings Calendar lists when established companies report, FDA Calendar lists drug decision dates, and Market Holidays lists days the exchanges are closed. A company shows up on the IPO Calendar before it has any history to report, and shows up on the Earnings Calendar after it does.
For a name that has already listed, Earnings Surprises and Dividends show its results and payouts once it has some.
What to check before you rely on it
- Dates move. A filed or even a priced date can slip if the deal is delayed or pulled. The page has no notice for that, so confirm the date near the day.
- Zeros are blanks. A 0 in Number Of Shares or Price means the value is not set, not that the offering is free or empty.
- Total Shares Amount on a filed row. It does not equal shares times price, since those are still 0. Read it as a planned size.
- An empty table is not proof of no IPOs. If the source fails to answer, the table shows no rows and no error. Try again, or pick another month and come back.
- Month scope. Search and paging work inside one month. Switch tabs for another month.
- Symbols on units. A ticker ending in U can be a bundle of shares and warrants, so its price is not the same as the later common share.
Who uses an IPO calendar
Day traders
Note debut dates so a new, thin name does not surprise a watchlist, and see which listings priced this week.
Options traders
Track new names that may later get option chains, and watch which ones have the size to attract active trading.
Swing and position traders
Look a month ahead at filed deals, then revisit as they price and start trading with some history.
Market watchers
Compare how many offerings and how much total size show up month to month as a rough read on how busy the IPO window is.