
Learn Center
Market Trend Signals
A scanner that labels each stock Buy, Sell, Retracement, Hold or Neutral, with short, medium and long term trend reads beside the price.
What are Market Trend Signals and how do you read them?
Market Trend Signals is a scanner that gives every stock in its table one plain label, such as Buy, Sell or Retracement (Buy the dip), plus a short Interpretation and three separate trend reads for the Short Term, Medium Term and Long Term. EZPZ puts the label, the reads, the price and two EMA values on one row, so you can sort a wide list by trend in seconds.
The label is the summary and the three reads are the evidence. When Short Term, Medium Term and Long Term all agree, the label is a clean Buy or Sell. When they disagree, the label changes to Retracement, Hold or Neutral, and the disagreement itself is the useful part. A stock that is Bullish on the Long Term and Medium Term but Bearish on the Short Term is usually a pullback inside a bigger uptrend, not a broken chart. A stock that is Bearish on the Long Term but Bullish on the Short Term is usually a bounce inside a downtrend. Read the Signal first, read the Interpretation for the plain-language version, then check the three reads and the two EMA columns to see how much of the picture agrees. The exact methodology is proprietary, so this guide covers how to read the page, not how the labels are built. It is a first-pass screen, not a trade instruction.
How the Market Trend Signals page works on EZPZ
The page is one purple-framed table under a header card. The header card holds four controls: a Signal dropdown that opens on All Signals, a Search ticker box, a Go button, and a Filter Columns menu. The table has eleven columns and opens sorted by Avg. Vol.(30D) from high to low, so the most heavily traded names come first. It loads when you open the page and again each time you change the dropdown or run a search. A spinner shows while it loads, and it does not refresh on its own, so reload or re-apply a filter if you leave the tab open for a while.
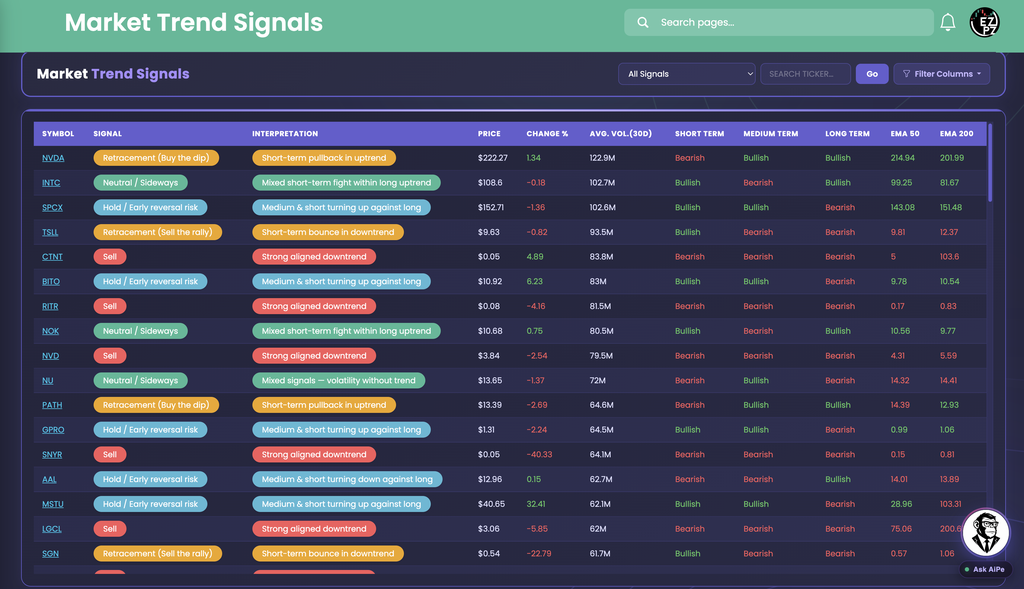
Start with the pill colors. In this capture, Sell rows are red, Retracement rows are amber, Hold rows are blue, and Neutral / Sideways rows are a teal green. The Interpretation pill takes the same color as its Signal pill, so a whole row reads at a glance. No Buy row is visible in the rows shown here, so use the Signal dropdown to pull those up.
Now compare four rows. NVDA is $222.27, up 1.34, labeled Retracement (Buy the dip) with the Interpretation Short-term pullback in uptrend. Its reads are Short Term Bearish, Medium Term Bullish and Long Term Bullish, and its price sits above both EMA 50 (214.94) and EMA 200 (201.99). TSLL is the mirror image: $9.63, labeled Retracement (Sell the rally) with Short-term bounce in downtrend, Short Term Bullish, Medium Term Bearish, Long Term Bearish, and a price below both EMA 50 (9.81) and EMA 200 (12.37). RITR is $0.08 and labeled Sell with Strong aligned downtrend, Bearish on all three reads. SPCX at $152.71 is the interesting one: it is labeled Hold / Early reversal risk with Medium & short turning up against long, Short Term and Medium Term Bullish, Long Term Bearish, yet its price is above EMA 50 (143.08) and EMA 200 (151.48). Price above both EMAs and a Bearish Long Term read can appear on the same row, which is why the columns are worth reading together instead of trusting any one of them.
How Market Trend Signals differs from the rest of stocks-strategies
Market Trend Signals is a one-row-per-stock trend scanner with a label on every row. Retail Trend Navigator is its chart companion: every ticker in this table is a link that opens that stock there in a new tab, where you can see the short, intermediate and long term views drawn out. Weighted Alpha ranks stocks by a single momentum score and Historical Weighted Alpha charts that score for one ticker over time. Stocks Outperforming keeps four performance windows beside a pinned SPY row, and Relative Strength (RS) Ranking turns performance into a percentile rank. Volatility Deviations ranks moves that stretched past a stock's normal range. Trend Trading Strategy is a members reading page on risk to reward and ATR stops, with no ticker table. WarriorTrading Setup is a low float day trading setup, and Peter Lynch Fundamental Screener is a valuation screen.
Nearby pages in other categories answer related questions. Top Gainers and Losers ranks one day of percent change, and Volume Leaderboard ranks trading activity. Technical Analysis reads one ticker's indicators, Top-50 Aggregate Technicals summarizes technicals for large stocks, and Market Price Action Trend charts the market and one ticker together. For a one-symbol dashboard, Ticker Explorer is the next stop.
Reading the columns
Read left to right: the label, the plain-language note, the market data, the three trend reads, then the two EMA values.
| Column or label | What you are looking at |
|---|---|
| Symbol | The ticker. It is a link that opens the stock on Retail Trend Navigator in a new tab. This is the only column you cannot hide. |
| Signal | The overall label for the stock, shown as a colored pill. It is always one of six values, listed below. |
| Interpretation | A short plain-language note explaining the Signal, in a pill of the same color. Examples in the capture: Short-term pullback in uptrend, Short-term bounce in downtrend, Strong aligned downtrend, and Mixed short-term fight within long uptrend. |
| Buy Sell | The three timeframe reads generally line up. Buy is the bullish version and Sell is the bearish one. In the capture every Sell row reads Bearish on Short Term, Medium Term and Long Term. |
| Retracement (Buy the dip) | The longer-term trend is still up, but a shorter-term pullback is under way. NVDA in the capture is the example. |
| Retracement (Sell the rally) | The longer-term trend is still down, but a shorter-term bounce is under way. TSLL in the capture is the example. |
| Hold / Early reversal risk | The reads are not fully aligned and a turn may be forming. SPCX and AAL both carry this label in the capture, with opposite leanings: SPCX says medium and short turning up against long, and AAL says medium and short turning down against long. |
| Neutral / Sideways | Mixed reads with no clear trend. INTC and NU carry it in the capture, and their Interpretations describe a short-term fight inside a long uptrend and mixed signals without a trend. |
| Column | What you are looking at |
|---|---|
| Price | The current price with a dollar sign, in white. |
| Change % | The percentage price change, printed as a bare number with two decimals and no percent sign. Green at zero or above and red below zero. An exact zero prints as a dash. |
| Avg. Vol.(30D) | The 30-day average daily volume, shortened to a compact figure such as 122.9M or 64.5M. The table opens sorted by this column, highest first. |
| Column | What you are looking at |
|---|---|
| Short Term | The stock's short-term trend read. Bullish is green and Bearish is red. A Neutral read shows in white. |
| Medium Term | The medium-term (intermediate) read. Bullish is green, Bearish is red, and Neutral shows in blue. |
| Long Term | The long-term read, colored the same way as Short Term. |
| EMA 50 EMA 200 | The 50 and 200 exponential moving average values. Each is green when the price is above it and red when the price is below it. Values print as stored, so you may see 5 or 103.6 with no trailing zero. |
Working the page
- Filter by Signal: the dropdown offers All Signals, Buy, Sell, Retracement (Buy the dip), Retracement (Sell the rally), Hold / Early reversal risk and Neutral / Sideways. Picking one reloads the table right away.
- Search a ticker: type a symbol in the box, then press Enter or click Go. The box turns your entry into uppercase. Your search and the dropdown are applied together.
- Filter Columns: the menu has a checkbox for every column except Symbol, all on by default. Your choices are remembered in your browser.
- Sorting: the table opens sorted by Avg. Vol.(30D), highest first, and the column headers are clickable to re-sort. There is no paging, so the whole list scrolls inside the table frame.
- Open the chart: click a ticker to open that stock on Retail Trend Navigator in a new tab.
- Missing values: a dash means the cell has no value. If nothing matches your filters, the table comes back empty, so clear the ticker box or pick All Signals.
- Ask AiPe: AiPe reads the rows on screen and your active filters. It can also set the Signal dropdown or the ticker search when you ask it to, and it will not explain how the labels are built.
How people actually use it
Build a trend shortlist
Choose Buy or Sell in the dropdown, then scan the rows where Short Term, Medium Term and Long Term all agree. Those are the cleanest trends on the page.
Spot pullbacks and bounces
Filter to Retracement (Buy the dip) to find stocks whose longer trend is still up, like NVDA in the capture. Retracement (Sell the rally) does the same on the downside.
Find turning points
Hold / Early reversal risk rows show timeframes pulling apart. Read the Interpretation to see which way the shorter reads are leaning, then check the chart.
Check a stock you already own
Type the ticker and read its label, its three reads and where price sits against EMA 50 and EMA 200, all on one row, instead of opening a chart first.