
Learn Center
Technical Analysis
Oscillator, moving average, and summary gauges for one symbol on any timeframe, with every indicator's value and signal listed below.
How do you read technical analysis buy and sell gauges?
A technical analysis gauge turns a stock's standard indicator readings into one label, from Strong Sell to Strong Buy. Each indicator votes Buy, Neutral, or Sell, and the gauge summarizes those votes. On EZPZ you get three gauges for one symbol and one timeframe: Oscillators, Moving Averages, and Summary.
Read them in layers. Start with Summary as the headline, then check whether Oscillators and Moving Averages agree. Oscillators describe momentum, so they react quickly to recent swings. Moving Averages describe trend direction over longer windows. When both point the same way, the picture is cleaner. When they split, momentum and trend are in tension, which often shows up in a stretched move or a pullback inside a larger trend. Under each needle sit three counts: a green up triangle for Buy, a grey dot for Neutral, and a red down triangle for Sell. A lopsided count says more than a near-even one. Two limits apply. The gauges describe price that has already traded, so they are not a forecast, and the same symbol can read differently on a 5 Minute chart than on a 1 Day chart. The exact methodology behind each label is not published. Use the labels, the counts, and the indicator tables together.
How the Technical Analysis page works on EZPZ
The page opens on SPY with the 1 Day timeframe. The header shows the symbol and its current price, such as SPY $761.69. Three controls sit on the right.
- Timeframe dropdown: 1 Minute, 5 Minutes, 15 Minutes, 30 Minutes, 1 Hour, 1 Day, 1 Week, or 1 Month. Changing it reruns the page right away.
- Filter ticker: type a symbol and press Enter or click Go to load it.
- Go: loads the typed symbol on the selected timeframe.
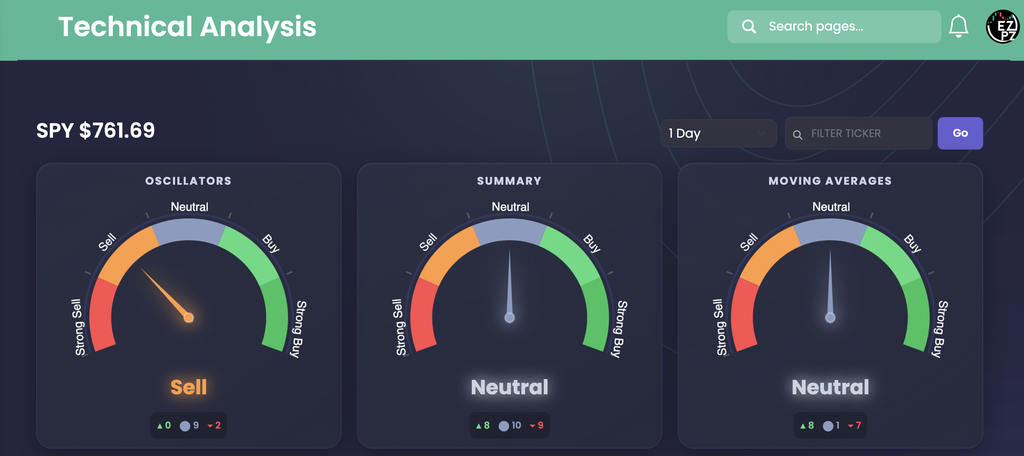
In the screenshot, Oscillators reads Sell with counts of 0 Buy, 9 Neutral, and 2 Sell. Moving Averages reads Neutral with 8 Buy, 1 Neutral, and 7 Sell. Summary reads Neutral with 8 Buy, 10 Neutral, and 9 Sell. Notice that Oscillators reads Sell even though Neutral is its biggest count, so do not assume the label is simply the largest number.
The three gauges
Momentum readings. They show how fast and how far price has been moving, and they are the more reactive of the two groups. Look here for stretched conditions and shifts in speed.
Trend readings. Exponential and simple averages across short and long windows, plus a few related lines. Look here to see whether price sits above or below its trend lines at different lengths.
The combined read across both groups. Use it as the headline for the symbol and timeframe, then open the other two to see what is behind it.
Each gauge uses the same five labels: Strong Sell, Sell, Neutral, Buy, and Strong Buy. The needle points at the label, and the label text repeats below the dial in a matching color.
The indicator tables
Below the gauges, two tables list every individual indicator behind them. Both use the same three columns.

| Column | What you are looking at |
|---|---|
| Indicator | The name of the reading, with its settings in brackets, such as Relative Strength Index (14). |
| Value | The current numeric reading. Use it to judge how strong or borderline a signal is, not just its label. |
| Signal | Buy in green, Sell in red, or Neutral in grey for that one indicator. A dash means no reading came back. |
The Oscillators table lists Relative Strength Index (14), Stochastic %K (14, 3, 3), Commodity Channel Index (20), Average Directional Index (14), Awesome Oscillator, Momentum (10), MACD Level (12, 26), Stochastic RSI Fast (3, 3, 14, 14), Williams Percent Range (14), Bull Bear Power, and Ultimate Oscillator (7, 14, 28). The Moving Averages table lists Exponential Moving Average and Simple Moving Average rows at 10, 20, 30, 50, 100, and 200, plus Ichimoku Base Line (9, 26, 52, 26), Volume Weighted Moving Average (20), Hull Moving Average (9), and Donchian Basis (20).
The screenshot shows a real split. Relative Strength Index (14) reads 49.20 and Stochastic %K reads 39.13, both Neutral, while Momentum (10) at -11.48 and MACD Level (12, 26) at -0.60 are the only two Sell rows. On the trend side, SPY at $761.69 sits above the longer averages, with Exponential Moving Average (200) at 725.17 and Simple Moving Average (200) at 714.24 both Buy, but below several shorter ones, with Simple Moving Average (20) at 764.30 and Simple Moving Average (30) at 766.71 both Sell. That reads as a short-term pullback against a longer uptrend picture, which is why the Moving Averages gauge lands on Neutral.
How Technical Analysis differs from the rest of stocks-analytics
This page reads one symbol you choose, on a timeframe you choose, from standard indicators. The regime pages instead give a score and a regime label, not a Buy or Sell rating. Intraday Regime Leaderboard scores high-liquidity symbols for the current session. Swing Regime Leaderboard scores setups held for days to weeks. Investing Regime Leaderboard covers the longer horizon. Top-50 Aggregate Technicals shows one indicator across the fifty largest stocks at once, while this page goes deep on one. Market Price Action Trend compares the market with one ticker as two stacked trend charts with an EMA ribbon. Seasonal Returns shows how a ticker has historically performed in each calendar month. Predictive CandleScope looks forward instead, with a probabilistic 24-hour price forecast for a ticker. Volume Surge Trades is a flow page, showing S&P 500 buy versus sell dollars by sector and stock instead of indicator readings. Top Money Flow ranks stocks by dollars traded today. Use this page when the question is what the standard indicators say about a single name right now. For the wider picture of that name, Ticker Explorer is the one-symbol dashboard.
How people actually use it
Get a fast headline
Load a symbol and read the Summary gauge first. It tells you in one label whether the standard indicators lean bullish, bearish, or undecided.
Compare momentum to trend
Check whether Oscillators and Moving Averages agree. A split often marks a stretched move or a pullback inside a larger trend.
Check more than one timeframe
Run the same symbol on a shorter and a longer timeframe, such as 15 Minutes and 1 Day. If they disagree, the signal may be a short-term blip and not a multi-timeframe trend.
Judge how borderline a signal is
Open the tables and read the Value beside each Signal. A reading close to its edge is a weaker vote than one far past it.