
Learn Center
Relative Strength (RS) Ranking
A table that ranks stocks by how their 1, 3, 6, and 12 month performance compares with SPY, in the style William O'Neil popularized.
What is an RS ranking system, William O'Neil style?
A relative strength ranking system scores each stock on how its price performance compares with the market, then ranks it so leaders separate from laggards. In the style William O'Neil popularized, that comparison is made over several lookback windows, not one. EZPZ does this against SPY across 1, 3, 6, and 12 months and rolls the four readings into a Weighted Rank.
The idea is simple. A stock that rose 20% in a market that rose 25% did not lead anything, while a stock that rose 20% in a flat market did. Ranking against a benchmark, and doing it over more than one window, filters out both. A stock that beat SPY over a year but lagged it over the last three months reads very differently from one that beat it in every window. This page is also not the RSI, the relative strength index, which measures one stock's recent gains against its own recent losses and never compares it with anything else. A high rank tells you a stock has already been outperforming. It does not tell you what happens next, and it says nothing about valuation or news.
How the RS Ranking System works on EZPZ
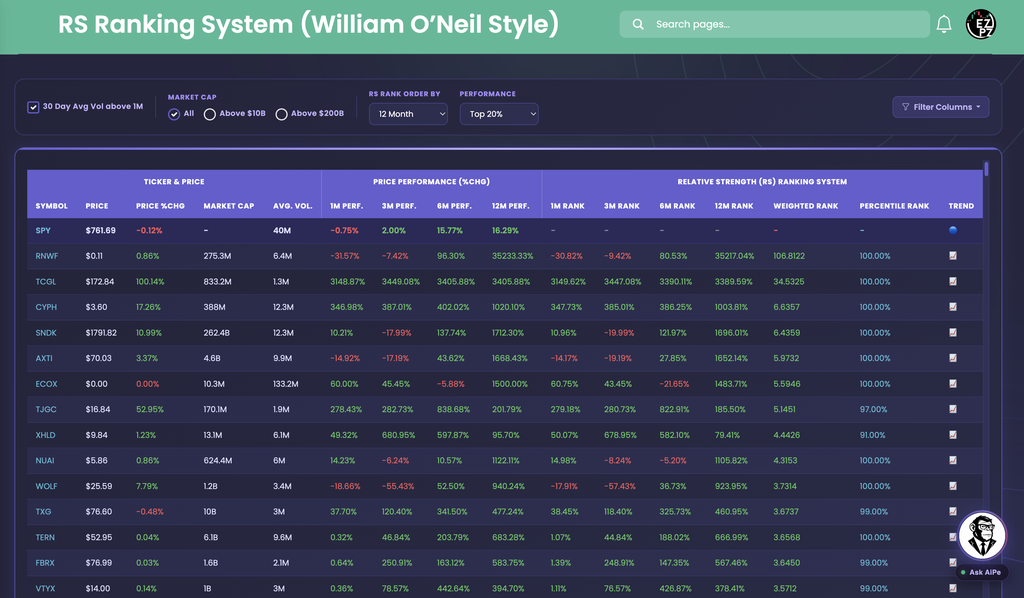
One filter card sits above one table. The filter card has a 30 Day Avg Vol above 1M checkbox, a Market Cap choice, two dropdowns named RS Rank Order By and Performance, and a Filter Columns menu. Every control except Filter Columns reloads the table. SPY is always the first row, tinted and pinned under the header, so every stock has a benchmark beside it. Rows load sorted by Weighted Rank from highest to lowest, and you can click any column header to re-sort. SPY stays on top either way.
| Control | Options | What it does |
|---|---|---|
| 30 Day Avg Vol above 1M | On or off | On by default. Keeps only names that average more than 1M shares a day. Turn it off to see thinner stocks. |
| Market Cap | All, Above $10B, Above $200B | All is the default. The other two drop everything smaller. |
| RS Rank Order By | 12 Month, 6 Month, 3 Month, 1 Month | 12 Month is the default. Picks the window that the Percentile Rank column shows and that the Performance cutoff is applied to. |
| Performance | Top 20%, Top 30%, Top 40%, Top 50% | Top 20% is the default. Widen it to see more of the list. |
| Filter Columns | Three column groups | Hides or shows columns. It changes what you see, not what is loaded. |
Filter Columns lists the three header groups, Ticker & Price, Price Performance (%Chg), and Relative Strength (RS) Ranking System, with a checkbox on each group and on each column inside it. Checking or unchecking a group flips all of its columns at once. The browser remembers your choices the next time you open the page.
In this capture, SPY reads $761.69 and -0.12% on the day with 1m, 3m, 6m, and 12m Perf. of -0.75%, 2.00%, 15.77%, and 16.29%. Its Rank columns, Weighted Rank, and Percentile Rank are dashes, so the benchmark carries no rank. Its Trend cell is a blue dot.
How the RS Ranking System differs from the rest of Stocks Strategies
This page turns performance into ranks against SPY. Stocks Outperforming shows raw 7 Day, 2 Week, 3 Month, and 6 Month returns under a pinned SPY row, with Days Up, Avg Return, Std Dev, and Sharpe Ratio, and leaves the comparison to you. Trend Trading Strategy is a members reading page on risk to reward, ATR stops, and regime, with no ticker table. Weighted Alpha and Historical Weighted Alpha boil a year of trend into one recency weighted score. Retail Trend Navigator and Market Trend Signals read trend from moving averages. Volatility Deviations looks for moves that stretched past a stock's normal range. WarriorTrading Setup is a low float day trading setup, and Peter Lynch Fundamental Screener is a valuation screen. Here everything is price history against one benchmark. For the RSI oscillator, see Technical Analysis. For one name after you have picked it, Ticker Explorer is the one-symbol dashboard.
Reading the columns
Read a row left to right: what the stock is, how it performed, then how that performance ranks.
| Column | What you are looking at |
|---|---|
| Symbol Price | The ticker and its current price. |
| Price %Chg | Today's percent change. Green is up, red is down. |
| Market Cap | Company market capitalization. A dash means no value. |
| Avg. Vol. | Average daily trading volume. |
| Column | What you are looking at |
|---|---|
| 1m Perf. 3m Perf. 6m Perf. 12m Perf. | The raw percent price change over each window. Green is positive, red is negative. |
Perf. is the stock alone. It says nothing about the market. SNDK's 6m Perf. is 137.74% and SPY's is 15.77%, so the gap between them is the story, and that gap is what the Rank columns carry.
| Column | What you are looking at |
|---|---|
| 1m Rank 3m Rank 6m Rank 12m Rank | The relative strength reading for that window, shown as a percentage. Green is above the neutral baseline and red is below it. A dash means no reading. |
| Weighted Rank | One composite number built from the four Rank windows. Higher is stronger. This is the default sort. |
| Percentile Rank | The rank value for whichever window RS Rank Order By is set to. |
| Trend | A quick read of Weighted Rank. An up-chart icon is positive, a down-chart icon is negative, and a blue dot is neutral or no data. |
Two rows from the capture show why the windows matter. SNDK reads 12m Rank 1696.01% and 6m Rank 121.97%, but its 3m Perf. is -17.99% and its 3m Rank is -19.99% in red. NUAI reads 12m Rank 1105.82%, but its 6m Rank is -5.20% and its 3m Rank is -8.24%, both red. Both sit at 100.00% Percentile Rank on the 12 Month setting. So do several other rows in this capture, which means Percentile Rank alone does not separate them. Use the four Rank columns to see whether strength shows up in every window or only the longest one.
How people actually use it
Find durable leaders
Set RS Rank Order By to 12 Month, keep Performance at Top 20%, and look for rows where 1m, 3m, 6m, and 12m Rank are all green.
Catch newer strength
Switch RS Rank Order By to 1 Month or 3 Month to surface names that only recently began to beat SPY, then compare them with their 12m Rank.
Clean up the noise
Choose Above $10B or Above $200B and leave 30 Day Avg Vol above 1M on when a few low priced names crowd the top.
Cross-check the raw returns
Open Stocks Outperforming to see how steadily a name got there, then a chart before you act.