
Learn Center
Swing Regime Leaderboard
A -100 to +100 score and five-label regime for multi-day setups, with a ticker page that shows what sits behind one symbol's score.
What is a swing regime score?
A swing regime score is a single reading from -100 to +100 that describes how a stock's setup looks for a trade held over several days to a few weeks. Positive numbers lean bullish, negative numbers lean bearish, and numbers near zero mean no clear edge. Each score comes with a label from Strong Bull to Strong Bear.
Think of it as a setup quality gauge, not a price forecast. A high score says the stock's recent behavior, options positioning, and risk picture line up for the bullish side of a swing trade. It does not say the stock will rise. The five labels are Strong Bull, Bull Watch, No Trade, Bear Watch, and Strong Bear. Bull Watch and Bear Watch mean a setup is building but is not fully confirmed. No Trade means the readings are mixed.
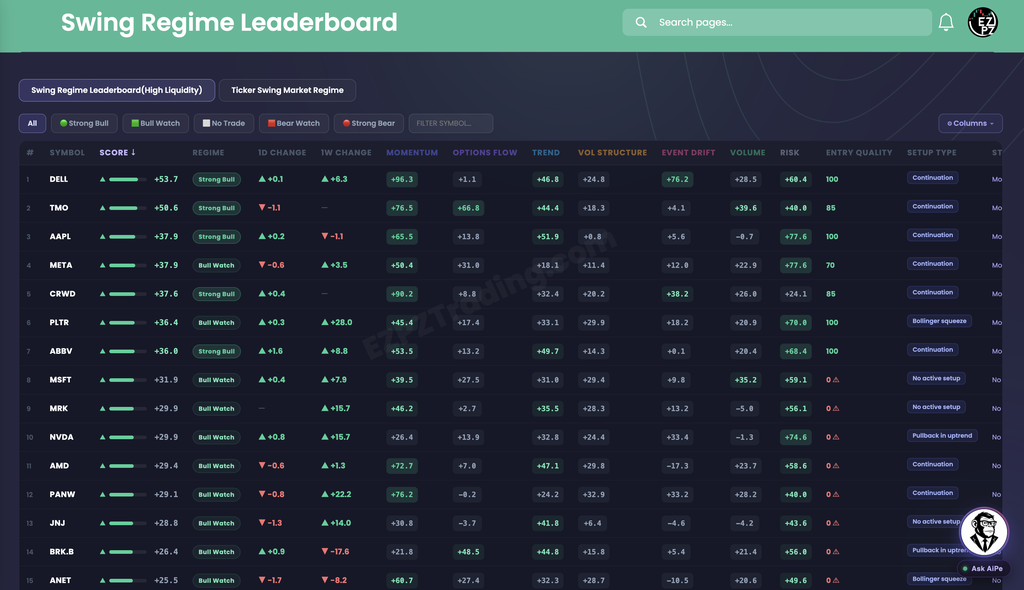
The number is only part of the read. Two stocks can share a score and still carry different labels, because the label reflects how well the underlying readings agree. In the screenshot below, AAPL and META both read +37.9. AAPL is labeled Strong Bull and META is labeled Bull Watch. Use the label, the seven category scores, and Entry Quality together, and do not draw your own cutoffs from the number. The exact methodology is not published.
On EZPZ the same score appears two ways. The leaderboard ranks many high-liquidity symbols in one table. The ticker page opens one symbol and shows what sits behind its score. Both are Premium pages.
How the Swing Regime pages work on EZPZ
Two tabs sit at the top of the page. Only one is open at a time.
Start on the leaderboard when you want to filter a group of names down to the ones that fit a swing approach. Switch to the ticker tab when you already have a name and want to know why it reads the way it does. Clicking a symbol in the leaderboard opens that symbol on the ticker page in a new browser tab.
How this differs from other Stocks Analytics pages
This is the swing regime page. Intraday Regime Leaderboard scores the current session and sorts by market cap, so open that one when you care about today. Investing Regime Leaderboard is the longer-horizon version. Technical Analysis and Top-50 Aggregate Technicals are indicator pages, not a five-label setup score. Predictive CandleScope is a candle-based view. Market Price Action Trend is the price trend chart. Volume Surge Trades, Top Money Flow, and Seasonal Returns each answer a different question.
Outside this category, Ticker Explorer is the one-symbol dashboard when you want quote, put to call ratio, and GEX charts instead of a regime score. Gamma Exposure is the strike table behind the GEX card. Dark Pool Flow is the print-by-print view behind Dark Pool Net Flow. Market Dashboard is the broad market snapshot.
Leaderboard columns and filters
Under the tabs, the page has a row of regime buttons: All, Strong Bull, Bull Watch, No Trade, Bear Watch, and Strong Bear. A Filter symbol box narrows the table by ticker. The table starts sorted by Score with the highest first. Click a column header with an arrow to sort by it. Regime, Setup Type, Strategy Fit, and Drivers/Detractors do not sort.
| Column | What you are looking at |
|---|---|
| # | Row number in the current sort. |
| Symbol | The ticker. Click it to open that symbol on the ticker page. |
| Score | A bar and the -100 to +100 number. Green is bullish, red is bearish. |
| Regime | The label: Strong Bull, Bull Watch, No Trade, Bear Watch, or Strong Bear. |
| 1D Change | How far the score moved since the previous session, with an up or down arrow. |
| 1W Change | How far the score moved over about a week. A dash means not enough history has built up yet, and the hover text says it accumulates after 5 trading sessions. |
| Momentum Options Flow Trend | Category scores on the same -100 to +100 scale. They show how each part of the picture leans. |
| Vol Structure Event Drift Volume Risk | Four more category scores. Vol Structure covers the volatility backdrop, Event Drift covers recent and upcoming catalysts, Volume covers participation behind the move, and Risk covers how clean the setup looks to execute. |
| Entry Quality | A 0 to 100 timing number, separate from the Score. A red warning icon appears when it is low. Hover it for the reason. |
| Setup Type | The pattern in play, such as Continuation, Bollinger squeeze, Pullback in uptrend, or No active setup. |
| Strategy Fit | A plain-language options approach for the current conditions, such as a directional call or No trade (mixed signals). It sits at the far right and you may need to scroll to see it. |
| Drivers/Detractors | Green pills for the categories helping the score and red pills for the ones dragging it. Off by default. |
The Columns button opens a Show / Hide Columns list grouped as Core, Category Scores, and Setup & Entry, with a Reset to default link. The page remembers your choice in your browser. Every column above is on by default except Drivers/Detractors.
Reading example rows
These rows come from the screenshot above. They show why the columns to the right of Score matter.
| Symbol | Score / Regime | 1D / 1W | Momentum / Options Flow / Trend | Entry Quality | What stands out |
|---|---|---|---|---|---|
| DELL | +53.7 Strong Bull | +0.1 / +6.3 | +96.3 / +1.1 / +46.8 | 100 | Momentum is very high while Options Flow is near flat. Event Drift is +76.2. Setup Type is Continuation. |
| TMO | +50.6 Strong Bull | -1.1 / dash | +76.5 / +66.8 / +44.4 | 85 | Momentum, Options Flow, and Trend all lean the same way. The 1W Change is a dash, so its history is still short. |
| AAPL | +37.9 Strong Bull | +0.2 / -1.1 | +65.5 / +13.8 / +51.9 | 100 | Same score as META, different label. Risk reads +77.6. |
| META | +37.9 Bull Watch | -0.6 / +3.5 | +50.4 / +31.0 / +18.1 | 70 | Same score as AAPL, but the label is one step lower and Entry Quality is lower. |
| MSFT | +31.9 Bull Watch | +0.4 / +7.9 | +39.5 / +27.5 / +31.0 | 0 with warning | A bullish score with No active setup and an Entry Quality of 0. The direction leans up, but the page is not flagging an entry. |
None of these rows is a call to buy or sell. They show how a strong score, a label, and a timing number can each say something different. Check Entry Quality and Setup Type next to the Score before you read a row as actionable.
Ticker Swing Market Regime tab
The second tab opens one symbol. Type a symbol in the box at the right and click Analyze. The header shows the symbol, its price, and the label EZPZ Swing Regime Score.

| Piece | What you are looking at |
|---|---|
| Regime banner | The label on the left, such as No Trade, and the big score on the right, +0.8 for SPY in the screenshot. |
| Banner tags | Setup Type (No active setup), Entry Quality (Entry: 0/100), Strategy Fit (No trade, mixed signals), and the 1D score change (1D: -0.3). |
| 15-Day Average | The average score over the last 15 sessions. It reads +3.3 in the screenshot. |
| All-Data Average | The average over all the history available. The card title carries the day count, so it reads 82-Day Average and +17.7 in the screenshot. |
| Swing Score gauge | A track from Strong Bear through No Trade to Strong Bull, with a needle at the current score. |
Compare the banner to the two averages. SPY reads +0.8 now, below both its 15-Day Average of +3.3 and its 82-Day Average of +17.7, so the score has cooled compared with its own history. That is a shift in the reading, not a promise about the next move.
Swing Score History
The chart plots the daily score for the last 82 days in the screenshot, with a pill showing how many days it holds. It only appears once enough history exists. Dots use the label colors from the legend: Strong Bull, Bull Watch, No Trade, Bear Watch, and Strong Bear. The Short EMA, Long EMA, and Extra EMA lines draw a ribbon around the score. The ribbon is green when the score sits above the Extra EMA and red when it sits below. The dashed line is the all-data average. Two buttons, the average toggle and EMA: ON, switch the dashed line and the ribbon. The EMA lengths are not published.
Use the chart to see how long a regime held, not just where it is now. A score that stays in a zone for several days is a steadier read than one that flips for a day. In the screenshot, SPY's score rolled over in September and sits near zero with a red ribbon.
Timeframe signals, category scores, and indicators

| Card | What you are looking at |
|---|---|
| 4H Daily Weekly | Three cards, one per chart timeframe. Each shows Bull, Neut, or Bear, a score out of 100, and a bar. In the screenshot they read Neut 55.5, Neut 46.0, and Neut 43.7. |
When all three point the same way the picture is cleaner. When they disagree, the setup is still forming or fading.
| Tile | What you are looking at |
|---|---|
| Momentum | How the stock's price momentum leans. It reads -3.8 in the screenshot. |
| Opts Flow | The overall options market signal. It reads +11.9. |
| Trend | The quality of the current trend. It reads +31.8. |
| Vol Struct | The volatility backdrop. It reads +11.8. |
| Event Drift | Recent and upcoming catalysts. It reads 0.0. |
| Volume | Participation behind the move. It reads -13.7. |
| Risk | How clean the setup looks to execute. It reads +88.9. |
These are the same seven categories as the leaderboard columns. In the screenshot they pull in different directions: Trend and Risk are positive, Momentum and Volume are negative, and the total is +0.8 with a No Trade label.
| Card | What you are looking at |
|---|---|
| RSI Daily | The daily RSI reading with a zone note. It reads 50 and Neutral zone. |
| MACD | Bullish or Bearish. It reads Bearish in the screenshot. |
| 3M RS Rank | Relative strength against the rest of the universe over about three months. It reads Average. |
| MA Position | Where price sits against key moving averages. It reads At MAs. |
| Weinstein | A long-term stage read. It reads Stage 2 with an up arrow. |
| Structure | Whether recent swings are making higher highs and lows or lower ones. It reads Lower Lows. |
| BB Squeeze | Whether Bollinger Bands are tight. It reads Squeeze with an up arrow. |
| P/C Ratio | The put to call ratio with a note. It reads 0.83 and Balanced. |
| Call Sweeps | Call sweep premium with put sweep premium underneath. It reads $764.4M calls and $74.6M puts. |
| RVOL | Relative volume against normal. It reads 1.14x and Normal vol. |
| Earnings | Days since the last earnings report, or a dash when there is nothing to show. It reads a dash for SPY. |
Each card has a small bar that shows whether it leans bullish, neutral, or bearish. Use them to see which readings agree with the regime and which do not. Not every input behind the score is shown here.
Market context, trade setup, options flow, and breadth
The lower part of the ticker page covers the backdrop around the score and the setup itself.

| Card | What you are looking at |
|---|---|
| VIX Regime | The volatility environment. It reads MID and Moderate volatility. |
| Market Breadth | A percentage with a short read. It shows 59.6% and Mixed breadth. |
| IV Rank (IVR) | How expensive options are against their own range. It shows 4.1% and the note Low IV, buy premium/spreads. |
| Card | What you are looking at |
|---|---|
| Strategy Fit | The recommended approach. It reads No trade (mixed signals). |
| Setup Type | The pattern in play, with Entry Quality under it. It reads No active setup and 0/100, with the note that the score is too weak for a directional signal. |
| Score Performance | The score change over 1 Day and 1 Week, plus an Updated line. It shows -0.3 and +1.6. |
Entry Quality can sit at 0 even when a name looks interesting, because it is a timing reading, not a direction reading. Read it separately from the Score.
| Card | What you are looking at |
|---|---|
| Dark Pool Net Flow | Net Buying, Net Selling, or Balanced, with buy and sell dollars for the last 5 days. It reads Balanced, Buy $3916.3M and Sell $3792.6M. |
| Unusual Sweeps | Call-Heavy, Put-Heavy, or Balanced, with call and put premium. It reads Call-Heavy, calls $764.4M and puts $74.6M. |
| Net Flow | Call-Skewed, Put-Skewed, or Balanced across all options premium. It reads Call-Skewed, calls $3072.9M and puts $269.1M. |
| GEX (Gamma Exposure) | Net dealer gamma. It reads -2.7B with the note that negative gamma means dealers are short gamma, which can amplify moves. |
Depending on the symbol, more cards can appear here, such as Put/Call Ratio, Insider Buys, DEX, and Near-Term Flow. Near-Term Flow scopes the call versus put premium to the nearest expiry only. The four above are what the screenshot shows.
| Card | What you are looking at |
|---|---|
| RS vs SPY (63D) | Relative strength against SPY over about three months, with a score out of 100. It reads +0.0% and 45/100. |
| VIX Directional | The VIX level and trend as a score out of 100. It reads 55/100 and Moderate, neutral. |
| Sector Breadth | How many of six sector ETFs sit above their 50-day average. It reads 3/6 above 50D. |
| RSP vs SPY | Equal-weight against cap-weight performance. It reads -0.65% and Narrow / fragile. |
| Section | What you are looking at |
|---|---|
| Top 2 Score Drivers & Top 2 Detractors | Up to two categories helping the score in green and up to two dragging it in red. SPY shows Trend/Structure +5.7 and Risk/Tradeability +4.5, both marked bullish. |
In the SPY screenshot the backdrop is mixed. The Options Flow and Dark Pool cards lean bullish or balanced, GEX is negative, and the breadth cards read neutral to fragile. That fits a No Trade label. Check these cards before you lean on the number.
How people actually use it
Build a watchlist
Click a regime button such as Strong Bull or Bull Watch, then sort by Score or by a category to see which names stand out.
Check timing separately
Look at Entry Quality and Setup Type next to the Score. A high score with an Entry Quality of 0 is a name to watch, not a name the page is flagging.
Open a name and compare
Click a symbol. Compare the banner to the 15-Day and All-Data averages, then use the history chart to see how long the regime held.
Reassess what you hold
Check whether the label, timeframes, and drivers still agree with your position. Use Ticker Explorer or Gamma Exposure for more on one symbol.