
Learn Center
Volatility Deviations
A live scanner that ranks stocks by how unusual today's price move is for each stock, with an Up tab and a Down tab.
What is a volatility deviation screener?
A volatility deviation screener ranks stocks by how unusual today's price move is for that particular stock, not by how big the move is in raw percent. The EZPZ Volatility Deviations page splits the list into an Up tab and a Down tab and shows each stock's move next to its own 20 day historical volatility.
A 5% jump means very different things for two stocks. For a sleepy bank stock that normally moves a fraction of a percent a day, 5% is a shock. For a small biotech that swings 8% most days, it is a normal Tuesday. Sorting by Change % alone puts the noisy stock on top every time. The Volatility column on this page fixes that by reading the move against the stock's own recent behavior, so a quiet name making a modest move can outrank a wild name making a huge one. The Up tab lists the highest readings first and the Down tab lists the lowest (most negative) readings first. HV 20 and Total Vol. sit beside each reading so you can judge how quiet the stock normally is and whether real volume showed up. The reading tells you a move is large for that stock. It does not tell you which way the stock goes next.
How Volatility Deviations works on EZPZ
The page is one table inside one card, with two tabs above it: Up and Down. Each tab is its own page with the same seven columns. Both tabs sort by the Volatility column when they open. Up puts the highest reading first, and Down puts the most negative reading first. The list shows up to 100 stocks. You can re-sort any column by clicking its header, and the table scrolls inside its card with the header row pinned. Data updates through a live connection, and while the market is open the page asks for fresh numbers about once a minute.
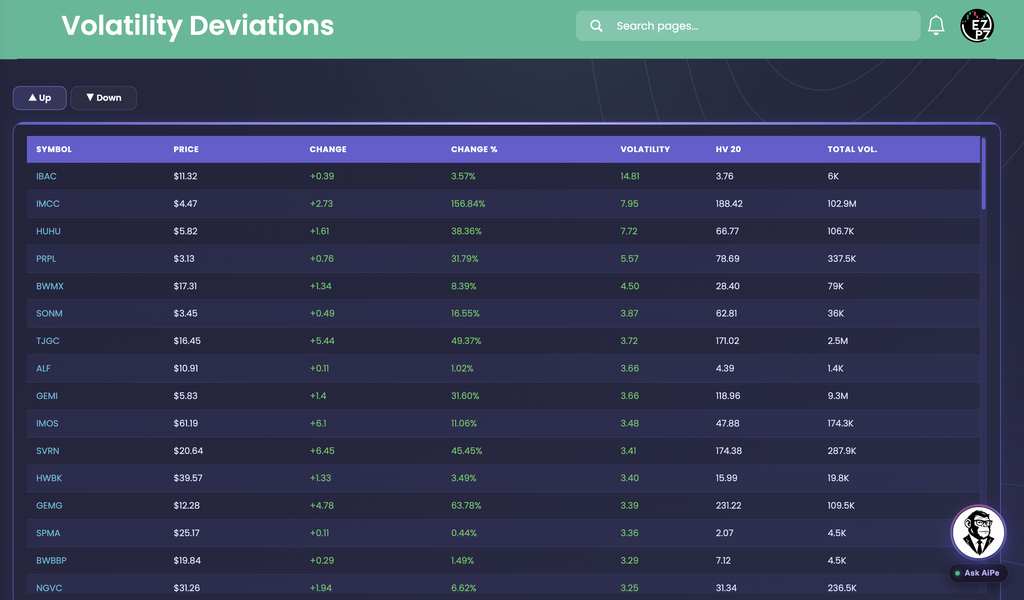
The top row shows why this is not a percent-change list. IBAC is up only 3.57% ($11.32, +0.39), yet it leads at a Volatility reading of 14.81, because its HV 20 is just 3.76 and a move that size is far outside its normal range. IMCC is up 156.84% ($4.47, +2.73), a much bigger headline move, and reads 7.95 because its HV 20 is 188.42. IMCC also traded 102.9M shares against 6K for IBAC, so the volume tells you which move had real participation.
The same contrast shows up lower on the list. ALF is up 1.02% ($10.91, +0.11) and reads 3.66 on an HV 20 of 4.39, while TJGC is up 49.37% ($16.45, +5.44) and reads 3.72 on an HV 20 of 171.02. Nearly identical readings, moves almost fifty times apart. GEMI ($5.83, +31.60%) sits between them at 3.66. In this capture the smaller moves on quiet stocks were often on very light volume, like ALF at 1.4K shares, so check Total Vol. before you treat one as meaningful.

On the Down tab, XENE leads at -14.95: down 31.26% ($39.42, -17.93) on 16.4M shares, against an HV 20 of 39.81. MKDW fell harder in percent, down 64.54% ($2.60, -4.73), yet reads only -4.53, because its HV 20 is 363.65 and a collapse is closer to normal for that stock. TAIL is down just 1.22% ($9.98, -0.12) and still reads -3.64 on an HV 20 of 5.36. Again the reading follows how unusual the move is, not how big.
How Volatility Deviations differs from the rest of stocks-strategies
Volatility Deviations is a live table of one-day moves measured against each stock's own normal range. Stocks Outperforming compares returns to SPY over four windows and never looks at how unusual a day was. Relative Strength (RS) Ranking ranks multi-window strength against SPY, and Weighted Alpha and Historical Weighted Alpha boil trend into a single score over a longer stretch. Trend Trading Strategy is a members reading page on risk to reward and stops, with no ticker table. Retail Trend Navigator and Market Trend Signals read trend direction, WarriorTrading Setup is a low float day trading setup, and Peter Lynch Fundamental Screener is a valuation screen. This page is about what moved today, relative to normal.
Related pages in other categories: Top Gainers and Losers ranks raw percent change, which is the list this page corrects for, and Range Change Leaders ranks moves from the open. Historical Volatility charts historical volatility for one ticker, and Ticker Explorer is the one-symbol dashboard to open next.
Reading the columns
Read a row left to right: what the stock is trading at, how it moved, how unusual that move was, how calm the stock normally is, and how much traded.
| Column | What you are looking at |
|---|---|
| Symbol Price | The ticker and its current price. A dash means there is no value. |
| Change | The dollar move. Green with a plus when up, red when down. |
| Change % | The percentage move, colored the same way. This is the raw size of the move, before it is compared to the stock's own range. |
| Column | What you are looking at |
|---|---|
| Volatility | The volatility deviation reading, shown to two decimals and the default sort. It says how far today's move sits from what is normal for that stock. Further from zero means more unusual. The header has a dotted underline and a hover tooltip. |
| HV 20 | The stock's 20 day historical volatility, shown to two decimals. A low number means the stock is normally calm, so a modest move stands out. A high number means big moves are routine for it. |
| Column | What you are looking at |
|---|---|
| Total Vol. | Total shares traded today, shown short (K, M). Use it to tell a move backed by real trading from a spike on a handful of shares, like ALF at 1.4K or IBAC at 6K in the capture. |
Working the table
- Up and Down tabs: click a tab to switch. Up opens with the highest readings first, and Down opens with the most negative readings first.
- Sorting: click any header, for example Total Vol. to bring the heaviest-traded names to the top, or HV 20 to group by how calm the stock normally is.
- Scrolling: the table scrolls inside its card and there are no pages. A spinner shows while it loads.
- Ask AiPe: AiPe reads the top rows on screen. Try asking which names have the highest reading, what a column means, or for a summary of the scanner.
How people actually use it
Find moves that are unusual for the stock
Skip the raw percent leaders and start with the Volatility column. A small move on a low HV 20 stock can be the bigger story, as with IBAC against IMCC.
Filter by volume
Sort by Total Vol. or scan that column. A high reading on heavy volume, like XENE at 16.4M shares, is more meaningful than one on a few thousand shares.
Check for a catalyst
A stock far outside its normal range usually has a reason. Look up news, earnings or a filing before you decide whether the move is a starting point or a one-off.
Watch risk on the Down tab
Check the Down tab against stocks you already hold. A large negative reading on a name you own is worth a look at the chart and the news.