
Learn Center
Recommendation Trends
How many Wall Street analysts rate a stock Strong Buy, Buy, Hold, Sell, or Strong Sell, tracked month by month.
How do you read analyst recommendation trends?
Analyst recommendation trends count how many Wall Street analysts rate a stock Strong Buy, Buy, Hold, Sell, or Strong Sell, month by month. Instead of one analyst's opinion, you see the whole distribution and how it shifts over time. On EZPZ you load any ticker and read it through four period gauges, a 12 month bar chart, and a data table.
Read the distribution before the headline. The size of the Hold slice, and the gap between Buy and Strong Buy, tell you more than a single "consensus buy" label. A stock with most ratings at Buy or Strong Buy, few at Sell, and stable counts from month to month has broad but unspectacular support. A shrinking Strong Buy slice or a growing Sell slice is a change in tone even when the majority still reads positive. Two limits matter. Analysts update ratings on their own schedule, so the counts often trail price and can lag news. And a rating is an opinion over the analyst's own horizon, not a forecast you can trade mechanically. The page reports counts, a Total, a Net Score, and a Buy % for each month, so you can compare one month with the next without adding anything up yourself. It does not show which firm made which call or what price target sits behind it.
How the Recommendation Trends page works on EZPZ
The page opens on AAPL. The header card shows the ticker with a blue price badge, such as AAPL $336.02, and the line "Analyst buy / hold / sell ratings over time". On the right, type a symbol into the search box and click Search to load another stock. The box uppercases what you type, and pressing Enter does nothing, so use the button. If a ticker has no price, the badge hides but the ratings still load.
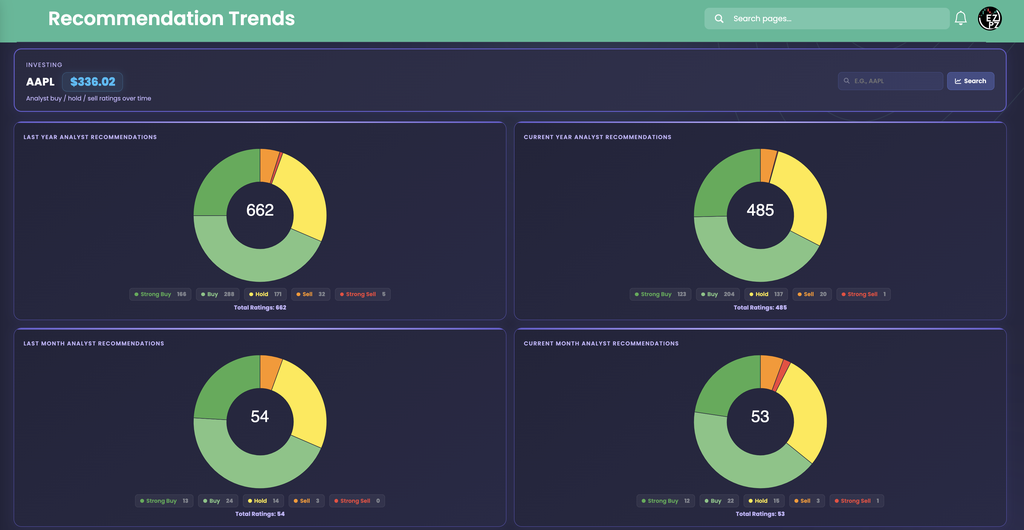
Below the header, the page stacks three blocks: the four gauges, a historical bar chart, and a data table. All three use the same five colors, so a color means the same rating everywhere on the page.
The four period gauges
Each donut covers a different window. The number in the middle is the total for that window, and the chips underneath give the count for each of the five ratings, with the same total repeated as Total Ratings.
| Gauge | Window it covers |
|---|---|
| Last Year Analyst Recommendations | Every monthly row from the previous calendar year. |
| Current Year Analyst Recommendations | Every monthly row so far in the current calendar year. |
| Last Month Analyst Recommendations | The row for the previous calendar month. |
| Current Month Analyst Recommendations | The row for the current calendar month. |
In the capture, Current Month reads 53 total: 12 Strong Buy, 22 Buy, 15 Hold, 3 Sell, and 1 Strong Sell. Last Month reads 54: 13 Strong Buy, 24 Buy, 14 Hold, 3 Sell, and 0 Strong Sell. That is one Strong Buy and two Buy ratings gone, one more Hold, and a first Strong Sell, a small but visible slide in tone.
When a window has no rows, the gauge shows five equal slices with 0 in the middle. Treat that as "no data", not as an even split.
The historical bar chart

Analyst Recommendation Trends, Historical is a stacked bar chart with one bar per month, oldest on the left and newest on the right. It shows up to the latest 12 months. Each bar stacks Strong Buy at the bottom, then Buy, Hold, Sell, and Strong Sell at the top, so the bar height is the total number of analysts and the dark green base is the Strong Buy count. Hover a segment to see its label and count. Click a name in the legend to hide that rating.
In the capture, the bars run from 2025-10-01 to 2026-09-01 and stay between about 53 and 57 analysts tall. The dark green base holds near 15 from October to December, dips to 14 in the winter and spring, returns to 15 in May, then falls to 12 by September. The 2026-09-01 bar is also the only one with a red Strong Sell segment on top. Watch the stacks change shape from left to right. A base that shrinks while the yellow and orange grow is the pattern to notice, and it can happen while the bar height stays flat.
The data table

| Column | What you are looking at |
|---|---|
| Ticker | The symbol you searched. |
| Period | The month the row belongs to, written as a date such as 2026-09-01. The table opens sorted newest first. |
| Strong Buy, Buy, Hold, Sell, Strong Sell | How many analysts sit in each rating that month, colored to match the gauges and the chart. |
| Total | The five counts added together, which is the number of analysts counted for that month. |
| Net Score | One number that leans positive when the ratings lean bullish. Strong Buy and Strong Sell count for more than Buy and Sell, Buy pushes it up, Sell pushes it down, and Hold leaves it alone. It grows with the number of analysts, so compare a stock with itself over time, not against another ticker. |
| Buy % | The share of that month's analysts who rate the stock Strong Buy or Buy. It is the easiest column to compare across tickers because it does not depend on how many analysts cover the stock. |
The table has no search box. Use the page controls under it to move to older months.
Reading the AAPL example
The table gives the clearest read. In the 2026-05-01 row, AAPL has 15 Strong Buy, 24 Buy, 13 Hold, 2 Sell, and 0 Strong Sell, for a Total of 54, a Net Score of 52, and a Buy % of 72.2%. That is the strongest month on the page. By 2026-09-01 it is 12 Strong Buy, 22 Buy, 15 Hold, 3 Sell, and 1 Strong Sell, for a Total of 53, a Net Score of 41, and a Buy % of 64.2%, the lowest of the ten rows shown.
Three things moved at once: the Strong Buy count lost three, Hold gained two, and the first Strong Sell appeared. Even so, 34 of 53 analysts still rate the stock Strong Buy or Buy. The story is "still mostly positive, but less so than in May", and the trend is what the page is built to show. Total analysts barely changed, so this is analysts changing their minds, not analysts arriving or leaving.
How Recommendation Trends differs from nearby Investing pages
This page answers "how are analysts distributed across ratings, and is that shifting?" For the rest of the research picture, use the neighbors. Upgrade and Downgrade lists individual rating changes with the firm and the date, which is the event behind a count moving here. Price Target shows the price levels analysts expect, which a rating bucket cannot tell you. Earnings Surprises and Analyst Estimates cover reported results and forward numbers, the inputs analysts use to set ratings. Social Sentiment measures retail chatter, which is a different crowd from sell side analysts. Ticker Performance shows what the price itself did, with returns, moving averages, and 52 week ranges, so you can set the analyst mood beside the price action. Support and Resistance marks price levels where the stock has stalled before. Congressional Trading covers a different group, the stock trades that lawmakers disclose, if you want to see who else is trading a name. For the sector yardstick behind a fundamental ratio, Sector Metrics shows the Actual and Median readings for each sector. Market News lists the general financial headlines that often sit behind a change in analyst mood. Company Profile shows what the company does and how large it is, useful context for who is rating it. Company News lists recent headlines for one ticker. Financial Statements shows the reported revenue, profit, debt and cash that analysts base their ratings on. For the standard fundamental ratios behind the company, Basic Financials groups valuation, profitability, growth, debt, and dividends for one ticker. Historical Market Cap charts a company's total value over a date range, which you can hold up against how ratings shifted. Dividends lists each cash payment a company has made, a payout record that a rating count does not show.
Outside this category, Ticker Explorer is the one-symbol dashboard when you want a live quote and options context next to the ratings you just read.
What to check before you rely on it
- Direction of the Strong Buy base. Look at the dark green at the bottom of each bar first. It is the most committed group.
- Hold growth. A rising yellow band often means analysts are waiting, not turning negative.
- New Sell or Strong Sell segments. Any appearance of orange or red after a run of empty months is a change in tone worth reading about.
- Buy % against Net Score. If both fall together, sentiment is fading. If only Net Score falls, look at whether the strong ratings shrank.
- Coverage size. A small Total means one analyst moving changes Buy % a lot. Read thinly covered names with care.
Who uses recommendation trends
Investors checking sentiment
Confirm whether the analyst crowd is warming or cooling on a stock you own or are researching.
Earnings watchers
Compare the month before and after a report to see whether ratings moved with the news.
Contrarian readers
Spot names where almost everyone already rates Buy, and ask how much of that is in the price.
Screeners of ideas
Use Buy % as a quick filter for how widely a stock is liked before opening its price target and filings.