
Learn Center
Gamma Short Squeeze
A setup where dealer gamma hedging and short seller covering can reinforce each other, amplifying a move in a stock beyond what either force would produce on its own.
What is a gamma short squeeze?
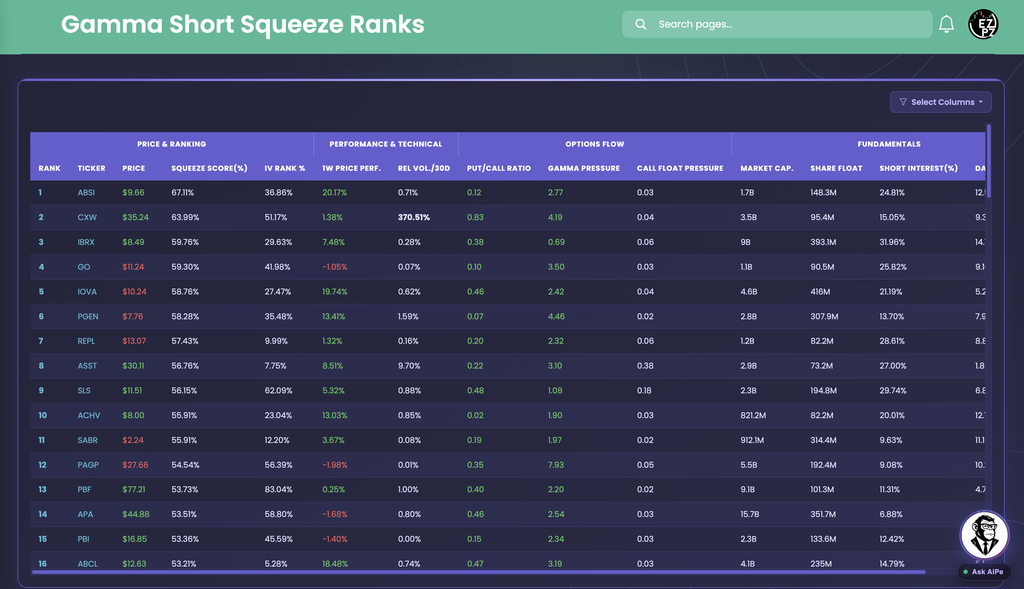
A gamma short squeeze is a ranked list of stocks where short covering and dealer hedging can sit on the same name. On EZPZ, Gamma Short Squeeze Ranks is one table. Rank starts at 1. Squeeze Score(%) sits next to Price and IV Rank %. It is not a trade ticket.
A short squeeze is buying that shows up when short sellers cover borrowed shares as price rises. Dealer hedging is a separate loop: when market makers who sold calls sit short gamma, they often buy the underlying as it rallies to stay hedged. Those two loops can line up. Squeeze Score(%) is the rank key on this page. Gamma Pressure and Call Float Pressure sit in Options Flow. Short Interest(%) and Days To Cover sit in Fundamentals. Rel Vol./30D and 1W Price Perf. show whether the name is already moving. A high Rank means those columns stacked toward the top of the list on this load, not that covering has started. A red 1W Price Perf. next to a high Squeeze Score(%) is still two clocks. A smaller Days To Cover is a faster cover clock than a larger one. None of those cells is a fill.
On EZPZ, the live page title is Gamma Short Squeeze Ranks. Header groups are Price & Ranking, Performance & Technical, Options Flow, and Fundamentals. Select Columns is the only page control. Rank and Ticker always stay on. AiPe in the corner is labeled Gamma Squeeze Analyst. The screenshot ranks ABSI first at $9.66 with Squeeze Score(%) 67.11%, then CXW at 63.99% and IBRX at 59.76%. Theta Farming is the universe scanner with Fit Score. Theta Performance tracks Seller P&L % on one ticker. Custom Strategies is the payoff builder. Volatility Risk Premium (VRP) is implied versus later realized. Directional Options Pressure is Short Straddle, Short Strangle (Δ20), Directional Pressure, and Net Volume. Greek Gods Dashboard is Ares, Hermes, Apollo, and Zeus on SPY Dashboard or SPX Dashboard. Contract Prices (XVWAP) is Price candles against XVWAP on one strike. Gamma Exposure is the strike table with Call Wall and Put Wall. Put to Call Ratio is Traded PCR, OI PCR, and Sentiment PCR on one ticker. IV Rank Explorer is Current IV (30D) and IV Rank (1Y). Ticker Explorer is the one-symbol dashboard after you already picked a name. Option Chain is the listed book.
How Gamma Short Squeeze works on EZPZ
Start at Rank 1, then read Squeeze Score(%) next to Gamma Pressure, Call Float Pressure, Short Interest(%), and Days To Cover. It is not a score you trade. Most people scan IV Rank % and 1W Price Perf. next. Open Select Columns if you want Rel Vol./10D, EMAs, or Short % Change. If the card prints Note: No gamma squeeze data available at this time, wait and reload. Do not treat ABSI as a default thesis.
How this differs from Theta Farming
Theta Farming is a universe scan for premium selling. Fit Score sits on Strategy Suggestions. This page is a squeeze rank table. Squeeze Score(%) is the sort key, not Fit Score. Use Theta Farming when you want Iron Condor next to Fit Score. Use this page when you want Squeeze Score(%) next to Short Interest(%). Use Theta Performance when you want Seller P&L % or Payoff at Expiration. Use Custom Strategies when you want a payoff diagram you assemble. Use Volatility Risk Premium (VRP) when you want OVERVALUED IV or UNDERVALUED IV. Use Directional Options Pressure when you want Straddle Profit % next to Directional Pressure. Use Greek Gods Dashboard when you want Ares next to Hermes on SPY or SPX. Use Contract Prices (XVWAP) when you want one strike's candles versus XVWAP. Use Gamma Exposure when you want Call Wall and Put Wall on one ticker. Use Put to Call Ratio when you want the session PCR chart. Use IV Rank Explorer when you want the 1Y clock. Use Ticker Explorer when you already have a symbol. Use Option Chain when you want listed strikes.
Select Columns
Select Columns is a dropdown, not a screenshot strip. Groups match the table headers, except the dropdown labels the second group Technical Indicators while the table prints Performance & Technical. Rank and Ticker are not in the menu. Empty table copy is No data available. Error copy is Unable to fetch data. Please check your API credentials or try again later.
| Group | What you can toggle |
|---|---|
| Price & Ranking | Price, Squeeze Score(%), and IV Rank %. All three start on. |
| Technical Indicators | 20Day EMA, 50Day EMA, 200Day EMA, Rel Vol./10D, Rel Vol./30D, Sharpe Ratio, and IV30 %. Rel Vol./30D starts on. The rest start off. |
| Options Flow | Call ITM, Call OTM, Call Depth Ratio, Put ITM, Put OTM, Put Depth Ratio, Put/Call Ratio, Gamma Pressure, and Call Float Pressure. Put/Call Ratio, Gamma Pressure, and Call Float Pressure start on. |
| Fundamentals | Market Cap., Share Outstanding, Share Float, Short Interest(%), Short % Change, and Days To Cover. Market Cap., Share Float, Short Interest(%), and Days To Cover start on. |
Anatomy of the rank table
Read a row left to right: Rank, then Squeeze Score(%), then the flow and short columns you left on. You do not need every field on every name. Use the tabs if you want a map.
These columns answer who sits at the top of this load.
| Column | What you are looking at |
|---|---|
| Rank | Position on the list. 1 is the highest Squeeze Score(%) on this load. The screenshot prints 1 on ABSI. |
| Ticker | The symbol on that row. |
| Price | Last price. Green is above the prior close. Red is below. The screenshot prints $9.66 on ABSI. |
| Squeeze Score(%) | The rank key, shown as a percent. A higher number sits higher on Rank. The screenshot prints 67.11% on ABSI and 63.99% on CXW. |
| IV Rank % | Where implied volatility sits versus that name's own range. The screenshot prints 36.86% on ABSI and 83.04% on PBF. |
These columns answer recent price and volume versus moving averages. Rel Vol./30D starts on. The EMA columns start off.
| Column | What you are looking at |
|---|---|
| 1W Price Perf. | One-week price change. Green is up. Red is down. The screenshot prints 20.17% on ABSI, 13.41% on PGEN, and -1.05% on GO. |
| 20Day EMA 50Day EMA 200Day EMA | Moving averages. Price prints green when last is above that EMA, red when it is below. |
| Rel Vol./10D Rel Vol./30D | Relative volume versus a 10-day or 30-day baseline. Rel Vol./30D prints bold when the tape is running hot. The screenshot shows CXW in bold at 370.51%. |
| Sharpe Ratio | A risk-adjusted return figure when the feed has it. |
| IV30 % | 30-day implied volatility as a percent. |
These columns hang call and put structure on the same row. Put/Call Ratio, Gamma Pressure, and Call Float Pressure start on.
| Column | What you are looking at |
|---|---|
| Call ITM Call OTM | In-the-money and out-of-the-money call size, shown in compact units. |
| Call Depth Ratio | Call depth as a ratio. Green is at or above 1. Red is below 1. |
| Put ITM Put OTM | In-the-money and out-of-the-money put size, shown in compact units. |
| Put Depth Ratio | Put depth as a ratio. Red is at or above 1. Green is below 1. |
| Put/Call Ratio | Puts versus calls. Green is at or below 1. Red is above 1. The screenshot prints 0.12 on ABSI and 0.83 on CXW, both green. |
| Gamma Pressure | Options gamma pressure on the row. Green is at or above 0. Red is below 0. The screenshot prints 2.77 on ABSI and 7.93 on PAGP, both green. A negative reading would print red. |
| Call Float Pressure | Call pressure versus share float. The screenshot prints 0.03 on ABSI and 0.38 on ASST. |
These columns answer size and short positioning. Market Cap., Share Float, Short Interest(%), and Days To Cover start on.
| Column | What you are looking at |
|---|---|
| Market Cap. | Market cap in compact units. The screenshot prints 1.7B on ABSI and 9B on IBRX. |
| Share Outstanding | Shares outstanding. Starts off in Select Columns. |
| Share Float | Shares available to trade. The screenshot prints 148.3M on ABSI. |
| Short Interest(%) | Short interest as a percent of share float. The screenshot prints 24.81% on ABSI and 31.96% on IBRX. |
| Short % Change | Change in that short interest percent versus the prior print. Red is a rise. Green is a drop. Starts off. |
| Days To Cover | How many sessions of typical volume it would take to cover the short interest. It sits at the right edge, so scroll the table sideways to reach it. |
How people actually use it
Start at Rank 1
Read Squeeze Score(%) first. Then check Gamma Pressure against Short Interest(%) before you treat the name as loud.
Pair flow with float
Call Float Pressure next to Share Float is the options overlay on the same row. A small float with a high Short Interest(%) is still a row, not a thesis.
Turn columns on when you need them
Leave Rel Vol./30D on. Open Select Columns for Short % Change or Days To Cover if you want the prior print or the cover clock.
Take the name elsewhere
Open Ticker Explorer or Gamma Exposure after you already picked a symbol. This table is the scan, not the chain.