
Learn Center
WarriorTrading Setup
A live day trading scanner for stocks priced $2 to $30 that gap up 10% or more on unusual volume, with news and dark pool context beside each name.
What is the WarriorTrading setup scanner?
The WarriorTrading setup scanner is a live table of stocks that fit a momentum day trading pattern: a price between $2 and $30, a price change of at least 10%, trading volume at least 3x the 50 day average, and a news catalyst from the previous day. EZPZ builds the list for you and sorts it by Gap % so the biggest gappers come first.
The pattern comes from the day trading style taught by Ross Cameron of Warrior Trading, and the page embeds his video Proven Formula for Finding BEST Stocks to Day Trade (Step-by-Step Guide) beside the criteria. The idea is simple. A cheap stock that jumps on news and trades several times its normal volume is a stock in play, where buyers and sellers are fighting hard enough to move price fast. Watching the whole market for that by hand is impractical, so the scanner does the narrowing and leaves you a short list. The page states that EZPZ tested the strategy on five years of data with mild adjustments, and it tells you to trade the setup at the open. Those are the page's own claims about history, not a promise for any single trade. What the table gives you is a starting watchlist, and every name still needs its own chart read, its own news check and its own risk plan.
How the WarriorTrading setup scanner works on EZPZ
The page has two parts. At the top, a card lists the four criteria with green check marks next to the video. Below it, a single table lists the stocks that pass, with 11 columns. The table is fed live and opens sorted by Gap % from highest to lowest. If the market was open when you loaded the page, it refreshes about every five seconds on its own, so rows can move, appear or drop off while you watch. If the market was closed at load, the table loads once and stays put until you reload.
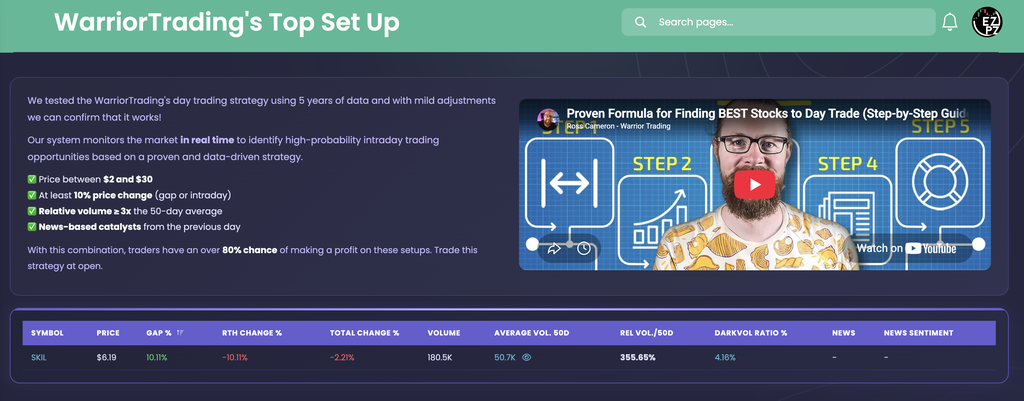
The capture has one row, SKIL at $6.19, and it teaches a few things. Gap % is a green 10.11%, so the stock opened well above the prior close, but RTH Change % and Total Change % are both red, so the gap has been giving back during the day. Volume is 180.5K against an Average Vol. 50D of 50.7K, which is the 355.65% shown in Rel Vol./50D. That clears the 3x rule, but on a small base: an average day of 50.7K shares is very thin trading, so the ratio is easy to hit and the stock is not deep. DarkVol Ratio % reads 4.16%. News and News Sentiment both read "-", so no article was attached to this row. Nothing in the table forces a news catalyst, so a "-" is your cue to check for one yourself.
How the WarriorTrading Setup differs from the rest of stocks-strategies
WarriorTrading Setup is a short intraday list built for the first hour of the session. Most of its neighbors work on days, weeks or months. Stocks Outperforming compares returns against SPY over four windows, Relative Strength (RS) Ranking turns performance into a rank, and Weighted Alpha and Historical Weighted Alpha score a year of trend with recent action weighted more. Retail Trend Navigator and Market Trend Signals read trend from moving averages. Volatility Deviations flags moves that stretched past a stock's normal range. Peter Lynch Fundamental Screener is a valuation screen, and Trend Trading Strategy is a members reading page on risk to reward and ATR stops. This page is the only one in the category that combines a gap, unusual volume and news in one live table.
Nearby pages in other categories answer related questions. Gap Up and Down lists gappers with no price band, no relative volume rule and no news column. Top Gainers and Losers ranks the day's percent change, Volume Leaderboard ranks trading activity, and Extended Hours Leaders covers pre-market and post-market movers. Volume Surge Trades reads dollar imbalance, and DarkVol Leaders ranks off-exchange volume. When a name catches your eye, Ticker Explorer is the one-symbol dashboard.
Reading the columns
Read a row from left to right: what the stock is, how far it moved and when, how much traded compared with normal, and whether there is a story behind it.
| Column | What you are looking at |
|---|---|
| Symbol Price | The ticker and its current price. Every row sits between $2 and $30. |
| Gap % | The jump from the previous close to today's open. It is the default sort, highest first. Green above zero. |
| RTH Change % | The move during regular trading hours only, from the open to now. Compared with Gap %, it tells you whether the gap is extending or fading. |
| Total Change % | The full move from the previous close, gap included. Green above zero, red below. |
| Column | What you are looking at |
|---|---|
| Volume | Total shares traded today, shown short (K, M). |
| Average Vol. 50D | The stock's average daily volume over the last 50 sessions. Click the eye icon next to the number to open an Avg Daily Trading Volume chart for that ticker. |
| Rel Vol./50D | Today's volume as a percentage of that 50 day average. Every row on the page is at 300% or more, and the number prints in bold. 355.65% means about 3.6 times normal. |
| DarkVol Ratio % | The share of today's volume that traded off exchange, on dark venues. A higher percentage means more of the activity was off the lit tape. |
| Column | What you are looking at |
|---|---|
| News | "Yes" with an eye icon when an article is attached to the symbol. Click it and the article opens in a new tab. It reads "-" when there is none. |
| News Sentiment | The sentiment tag on that article, such as Bullish, Somewhat-Bullish or Neutral. It reads "-" when there is no article. A row tagged Somewhat-Bullish gets a lighter background so it stands out. |
Working the table
- Start at the top. The table opens sorted by Gap % descending, so the largest gappers that also fit the volume rule are first.
- Confirm the volume. Look at Rel Vol./50D, then at Volume and Average Vol. 50D behind it. Click the eye icon to see the average over the last 90 days.
- Compare Gap % with RTH Change %. Extending, holding or fading is the first thing to know about a name.
- Check News and News Sentiment. Open the article. No article means no confirmed catalyst on this row.
- Glance at DarkVol Ratio %. It adds context on where the volume traded and is not a verdict on its own.
- Take the name to a chart. The table finds candidates. Entries, stops and sizing come from your own chart work.
- Sorting: click any column header to re-sort. The Gap % header shows a sort arrow because it is the default.
- Scrolling: the table scrolls inside its card, with no pages. A spinner shows while data loads.
- Colors: Gap %, RTH Change % and Total Change % are green above zero and red below. Symbol and DarkVol Ratio % print in teal.
- An empty table is normal. When nothing meets all the rules, such as on a quiet morning or off hours, there are simply no rows.
- Ask AiPe: AiPe sees the rows on screen. Ask which names look strongest, whether a gap is extending or fading, or where news and volume line up, and it answers from those rows.
How people actually use it
Build a morning watchlist
Check the table around the open and pick a handful of names with a large Gap %, strong Rel Vol./50D and a real article behind the move.
Separate extending from fading
Set Gap % beside RTH Change % and Total Change %. A gap that keeps growing is a different situation from one that has already slipped back, like SKIL in the capture.
Vet the catalyst
Click the News link and read the story. A fresh, specific catalyst is stronger than a vague or recycled headline, and a row with no article needs your own check.
Respect the base
Use Volume and Average Vol. 50D to judge how deep a stock really is. A high ratio on a tiny average can mean a thin, jumpy book, so plan smaller size.