
Learn Center
Directional Options Pressure
A read on whether options order flow in a name currently leans toward bullish or bearish positioning, built from aggregating trade level buying and selling pressure.
What is directional options pressure?
Directional options pressure is a live read of ATM short-straddle premium, delta-20 short-strangle premium, call versus put pressure, and net options volume on one ticker. On EZPZ, Directional Options Pressure is Chart View and Table View. Data Range starts on Current Day. Timeframe starts on 1m. Type a symbol, then Go. It is not a trade ticket.
A short straddle sells the at-the-money call and put. A short strangle sells an out-of-the-money call and put. On this page the strangle is Short Strangle (Δ20). Premium on those structures falls when implied volatility cools or time passes. It rises when traders pay up for protection. Directional Pressure is the green or red path How to Read the Chart labels as bullish or bearish bias from options flow. Net Volume is the bar pane: green for aggressive call buying, red for aggressive put buying. Info also contrasts a move in the underlying against a falling straddle, which it reads as less aggressively hedged, versus both rising together, which it reads as traders paying for insurance. A falling Short Straddle Price / 2 next to a quiet Directional Pressure line is still a path, not a fill. Short Straddle and Short Strangle still carry unlimited risk if you sell them without wings.
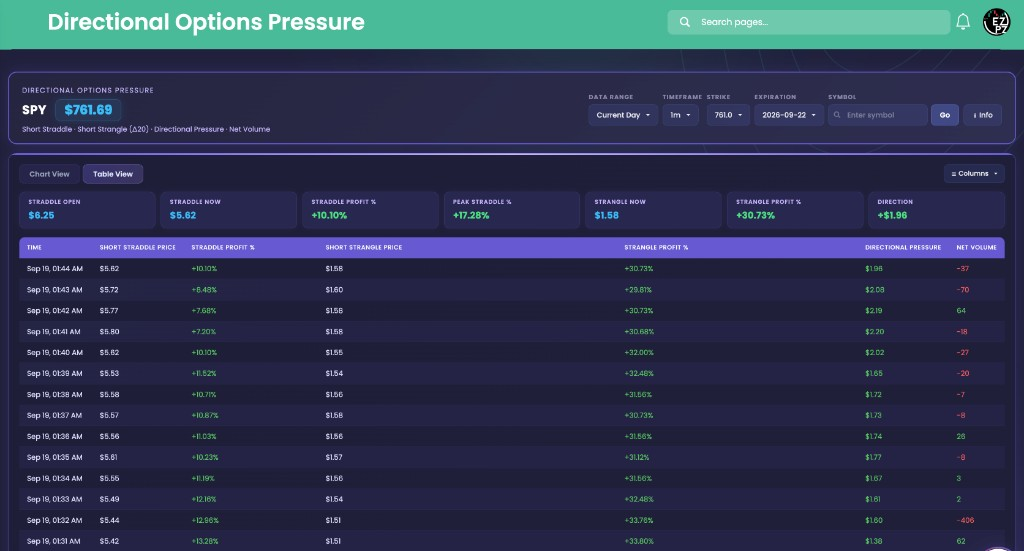
On EZPZ, the live page title is Directional Options Pressure. The subtitle is Short Straddle · Short Strangle (Δ20) · Directional Pressure · Net Volume. Controls are Data Range, Timeframe, Strike, Expiration, Symbol, Go, and Info. Data Range is Current Day or Historical. Timeframe is 1m, 5m, 10m, 15m, 30m, and 1h. Tabs are Chart View and Table View. Historical Daily appears when Data Range is Historical. Stat pills are Straddle Open, Straddle Now, Straddle Profit %, Peak Straddle %, Strangle Now, Strangle Profit %, and Direction. How to Read the Chart sits under the card. AiPe in the corner is labeled Directional Pressure Analyst. The screenshot uses SPY at $761.69, Current Day, 1m, Strike 761.0, and Expiration 2026-09-22. Theta Farming is the universe scanner with Fit Score. Theta Performance tracks Seller P&L % on one ticker. Custom Strategies is the payoff builder. Volatility Risk Premium (VRP) is implied versus later realized. Greek Gods Dashboard is Ares, Hermes, Apollo, and Zeus on SPY Dashboard or SPX Dashboard. Contract Prices (XVWAP) is Price candles against XVWAP on one strike. IV Rank Explorer is Current IV (30D) and IV Rank (1Y). Option Chain is the listed book. Ticker Explorer is the one-symbol dashboard after you already picked a name. Gamma Short Squeeze is Squeeze Score(%) ranks.
How Directional Options Pressure works on EZPZ
Type a ticker in Symbol, leave Current Day and 1m on, pick Strike and Expiration, then press Go. It is not a score. Most people start at Straddle Profit % and Direction. If Straddle Profit % is green, read Peak Straddle % next to Strangle Profit %. Switch to Chart View when you want Short Straddle Price / 2 against Directional Pressure. Open Table View when you want Time, Short Straddle Price, and Net Volume as rows. Open Info if you want the in-product Reference Guide.
How this differs from Theta Performance
Theta Performance is Options Income Strategies. Iron Condor Chart plots Net Credit Value and Seller P&L %. This page is one ticker with Short Straddle and Short Strangle (Δ20) on the same card as Directional Pressure and Net Volume. Use Theta Performance when you want Payoff at Expiration or Historical Range Performance. Use this page when you want Straddle Profit % next to Directional Pressure. Use Theta Farming when you want Fit Score across many names. Use Custom Strategies when you want a payoff diagram you assemble. Use Volatility Risk Premium (VRP) when you want OVERVALUED IV or UNDERVALUED IV. Use IV Rank Explorer when you want the 1Y clock. Use Option Chain when you want listed strikes. Use Ticker Explorer when you want quote, IV Rank, and unusual activity on one symbol.
Header, tabs, and stat pills
The header is the name you loaded. The pills are the latest mark, not a ticket. You do not need every column on every session.
These controls sit on the header. They are not a screenshot strip. Documented from the live labels.
| Control | What you are looking at |
|---|---|
| Data Range | Current Day starts on. Historical is the other pick. Historical disables 1m, 5m, and 10m and moves Timeframe to 15m. |
| Timeframe | 1m, 5m, 10m, 15m, 30m, 1h. Starts on 1m. The screenshot uses 1m. |
| Strike | The ATM straddle strike for this load. The screenshot prints 761.0. |
| Expiration | The listed expiration for that straddle and strangle. The screenshot prints 2026-09-22. |
| Symbol | Search box. Placeholder is Enter symbol. Go loads that ticker. |
| Info | Opens Directional Options Pressure, Reference Guide & Signal Interpretation. |
Chart View starts on. Table View is the same session as rows. Historical Daily is the third tab when Data Range is Historical.
| Tab | What you are looking at |
|---|---|
| Chart View | Short Straddle Price / 2, Short Strangle Price (Δ20), Directional Pressure, then Net Volume bars. |
| Table View | One row per stamp. Columns starts on Time, Short Straddle Price, Straddle Profit %, Short Strangle Price, Strangle Profit %, Directional Pressure, and Net Volume. |
| Historical Daily | Daily open and close for the straddle and strangle. Ticker and Days sit on the historical bar. |
| Columns | Table View only. Groups are General, Short Straddle, Short Strangle (Δ20), and Pressure. Straddle BE Upper, Straddle BE Lower, Strangle BE Upper, and Strangle BE Lower start off. |
The screenshot prints these values on SPY. They update with the latest stamp.
| Pill | What you are looking at |
|---|---|
| Straddle Open | ATM call plus put at the first stamp. The screenshot prints $6.25. |
| Straddle Now | ATM call plus put at the latest stamp. The screenshot prints $5.62. |
| Straddle Profit % | How much that combined premium has decayed versus open. Green is a drop in premium. The screenshot prints +10.10%. |
| Peak Straddle % | The best Straddle Profit % reached on this path. The screenshot prints +17.28%. |
| Strangle Now | Latest Short Strangle (Δ20) combined premium. The screenshot prints $1.58. N/A when the legs are missing. |
| Strangle Profit % | Decay versus that day's strangle open. The screenshot prints +30.73%. |
| Direction | Latest Directional Pressure as a dollar figure. The screenshot prints +$1.90 in green. |
Chart View and How to Read the Chart
Chart View is two panes. The upper pane is Short Straddle Price / 2, Short Strangle Price (Δ20), and Directional Pressure. The lower pane is Net Volume. How to Read the Chart is the legend card under the chart. Info repeats the same colors and adds hedge versus directional notes.

| On the chart | What How to Read the Chart says |
|---|---|
| Purple, Short Straddle Price / 2 | Average premium per leg (call + put) / 2 at ATM. Downtrend is theta decay. Uptrend is rising volatility expectations. Info says the chart uses price / 2 so you can compare it with a single option price. |
| Aqua, Short Strangle Price (Δ20) | Combined premium of the OTM call and put at delta 20. Lower than the straddle. The legend calls it a premium collection opportunity for theta sellers. |
| Green / Red, Directional Pressure | Intraday directional bias from options flow. Green is bullish pressure. Red is bearish pressure. |
| Bottom Bars, Net Volume | Buy and sell imbalance by contracts. Green is aggressive call buying (bullish). Red is aggressive put buying (bearish). |
Table View columns
Rows run newest first. Green Straddle Profit % is a drop in premium versus that day's open. The loudest and weakest percent cells get a highlight. Open Columns if you want the breakeven fields.
| Column | What you are looking at |
|---|---|
| Time | When that stamp printed. The screenshot uses month, day, and clock, such as Sep 19, 01:44 AM. |
| Short Straddle Price | ATM call plus put. The latest screenshot row prints $5.62. |
| Straddle Profit % | Decay versus that day's straddle open. The latest screenshot row prints +10.10%. |
| Straddle BE Upper Straddle BE Lower | Hidden until you turn them on in Columns. Upper is Strike plus Short Straddle Price. Lower is Strike minus Short Straddle Price. |
| Short Strangle Price | Δ20 call plus put. The latest screenshot row prints $1.58. N/A when a leg is missing. |
| Strangle Profit % | Decay versus that day's strangle open. The latest screenshot row prints +30.73%. |
| Strangle BE Upper Strangle BE Lower | Hidden until Columns is on. They use the Δ20 call strike and put strike plus or minus Short Strangle Price. |
| Directional Pressure | The same clock as the green or red chart path. The latest screenshot row prints $1.98. |
| Net Volume | The same clock as the bottom bars. The latest screenshot row prints -87. |
Historical Daily
Switch Data Range to Historical, then open Historical Daily. The header search hides. Ticker and Days take its place. Days starts on 30 Days. Empty copy is No data available.
| Control or column | What you are looking at |
|---|---|
| Ticker | SPY, QQQ, NVDA, AAPL, GOOG, META, MSFT, TSLA, AMZN. |
| Days | 7 Days, 14 Days, 30 Days, 60 Days, 90 Days. Starts on 30 Days. |
| Date Expiration | The session date and the expiration used that day. |
| Straddle Strike Straddle Open Straddle Close | ATM strike, then open and close premium. |
| Straddle Close % Straddle Highest % Straddle Lowest % | Close versus open, then the best and worst intraday percent. |
| Strangle Call Strike Strangle Put Strike | The Δ20 call and put used that day. |
| Strangle Open Strangle Close Strangle Close % | Open, close, and close percent on the strangle. |
| Strangle Highest % Strangle Lowest % | Best and worst strangle percent on that date. |
How people actually use it
Lock ticker, strike, and expiration
Type a name already on your radar. Leave Current Day and 1m on. Confirm Strike and Expiration before you read Direction.
Read decay next to pressure
Start at Straddle Profit % and Peak Straddle %. Then look at Directional Pressure and Net Volume. Green decay with mixed Net Volume is still two clocks.
Switch Chart and Table
Use Chart View for the purple, aqua, and green or red paths. Use Table View when you want Time and Short Straddle Price as numbers.
Open Historical last
Leave Days on 30 Days. Read Straddle Close % next to Straddle Highest % before you treat one green session as normal.