
Learn Center
Company Profile
One table of identifying facts for a ticker: description, listing, size, industry classification, ownership readings, and NAICS codes.
What is a company profile and how do you read it?
A company profile is the reference card for one stock: who the company is, where it is based, which exchange lists it, how big it is, and which industry it belongs to. On EZPZ, the Company Profile page shows a header with the ticker and last price, then one table of 26 labeled rows for the symbol you search. It opens on AAPL.
Use it to answer "what kind of business is this?" before you look at price action. The size rows (Market Cap, Shares Outstanding, Float Share) tell you how large and how tradable the company is. The classification rows (Industry, Group, Gind, Sector, Gsubind and four NAICS rows) tell you which peers to compare it with. The Description explains the business in plain sentences. Most of this rarely changes, so it is groundwork, not a signal. The page does not say whether a stock is cheap, and it does not forecast anything. Pair it with the price, options, and fundamentals pages once you know what you are looking at.
How the Company Profile page works on EZPZ
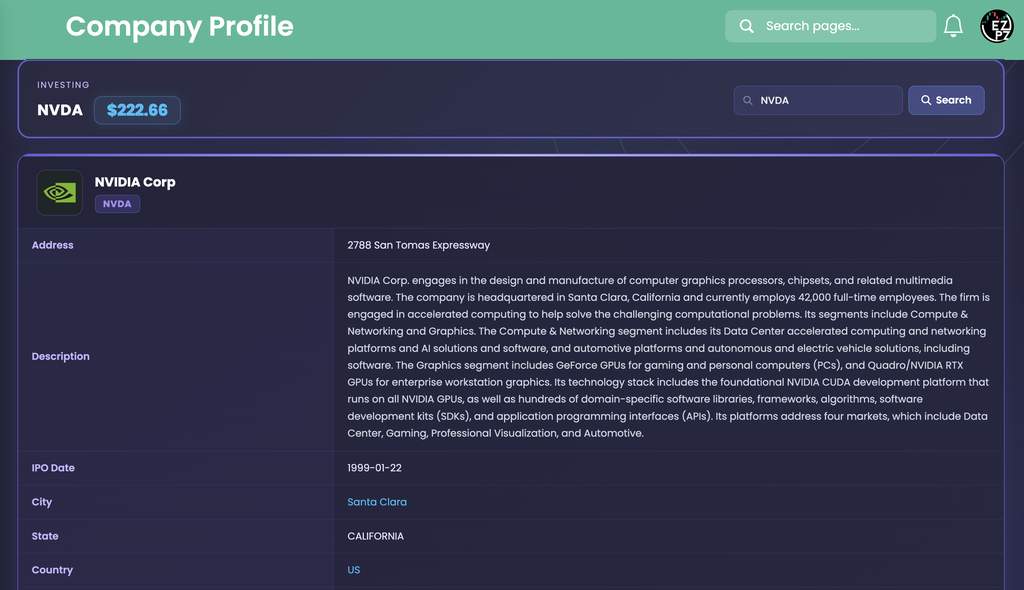
Type a ticker into the search box and press Search or Enter. The page fetches the profile once and shows a spinner while it loads. It does not refresh by itself, so search again for a fresh read. The header shows the ticker in white and the latest price in a blue badge. If no price comes back, the badge hides and the profile still loads. The logo, company name, and ticker sit at the top of the card, and if a logo is not available a small building icon stands in.
The rows, in the order they appear
Every row is a label on the left and a value on the right. Any value the profile does not have prints as a dash. Here is what each group means.
| Rows | What you are looking at |
|---|---|
| Address City State Country Phone Web URL | Where the company is based and how to reach it. Address is the street line only, and City, State, and Country carry the rest. State prints as supplied (CALIFORNIA in the capture). Web URL is a link that opens the company site in a new tab. Phone prints as bare digits with no spacing. |
| Description | A written summary of the business, its segments, and its products. It is the longest row and the fastest way to learn what a company actually sells. |
| IPO Date | The date the stock first traded publicly, as year-month-day. It is a quick read on how established the company is. |
| Currency Exchange | The currency shown for the company and the market it lists on. The exchange prints as a long name, such as NASDAQ NMS - GLOBAL MARKET. |
| Total Employees | The headcount, printed as a plain number with no thousands separator. |
| Float Share Market Cap Shares Outstanding | Size rows, printed in short form (K, M, B, T) to one decimal place. Market Cap and Shares Outstanding are green. |
| Industry Group Gind Sector Gsubind | A ladder of classification labels, from broad (Sector) to narrow (Gsubind). Group and Gind can read the same, as they do in the capture. |
| Insider Ownership Institution Ownership | Two ownership readings, printed as bare numbers. |
| ISIN | The company's international securities identifier, a 12 character code that starts with a country code. |
| NAICS NAICS National Industry NAICS Sector NAICS Subsector | The company's placement in the North American Industry Classification System, from a broad Sector down to a National Industry. |
Reading the capture (NVDA)

The header reads NVDA at $222.66, and the card is NVIDIA Corp. The IPO Date is 1999-01-22, and the company is listed on NASDAQ in USD. Total Employees reads 42000, which agrees with the "42,000 full-time employees" sentence in the Description.
The size rows check out against the price. Shares Outstanding reads 24.2B, and 24.2 billion shares at $222.66 is about $5.39 trillion, which matches the 5.4T Market Cap. Float Share reads 23.2B, about a billion shares below Shares Outstanding. Float counts the shares that are free to trade, so it is the smaller number. Market Cap and Shares Outstanding come from the profile, while the price badge comes from a separate price read, so on a fast-moving day the two can drift apart a little.
The classification rows show how the ladder narrows. Sector is Information Technology, Group and Gind both read Semiconductors & Semiconductor Equipment, and Gsubind and Industry both read Semiconductors. Insider Ownership reads 3.9597 and Institution Ownership reads 71.3384. The page prints no percent sign and does not state the unit, so treat them as rough context, and read them as percentages of shares only as a working assumption.

The four NAICS rows are the most surprising for a chip designer. NVDA reads as Manufacturing at the Sector level, and Electronic Computer Manufacturing at the National Industry level. NAICS files companies by what the business is classified as doing, so its labels can differ from the market-style Sector row above it. Neither one is wrong, and they answer different questions. Use Sector and Industry to find trading peers, and use NAICS when you want the government-style industry code family.
How to use the profile
- Read the Description first. It tells you what the company sells, which no row of numbers can.
- Judge the size. Compare Market Cap, Shares Outstanding, and Float Share. A Float Share far below Shares Outstanding means fewer shares actually trade.
- Check the peers. Match on Sector and Industry before you compare two stocks. Two companies with different classifications may not compare cleanly.
- Note the age. The IPO Date and Total Employees show how established the business is.
- Confirm the listing. Exchange and Currency matter when a ticker looks the same across markets.
- Verify the symbol. The company name and logo confirm you loaded the company you meant.
How Company Profile differs from nearby Investing pages
This page answers "what is this company, and how big is it?" The other Investing pages take a different question. Company News lists headlines about the one ticker, and Market News lists the general headlines that are not tied to a stock. Sector Metrics compares financial ratios with a sector Median, which pairs well with the Sector row here. Ticker Performance shows what the price did, with returns, moving averages, and 52 week ranges. Recommendation Trends counts analyst ratings by month, Upgrade and Downgrade logs each firm's rating change with a date, and Price Target shows the levels analysts expect. Earnings Surprises covers reported results against estimates. Social Sentiment measures how the retail crowd talks about a stock. Support and Resistance marks price levels where the stock has stalled before. Congressional Trading lists stock trades that members of Congress have disclosed.
For the numbers behind the business, use Financial Statements, Basic Financials, Historical Market Cap (which follows Market Cap over time), Dividends, and Analyst Estimates.
Outside this category, Ticker Explorer is the one-symbol dashboard when you want a live quote and options context next to the profile you just read.
What to check before you rely on it
- The unit. Insider Ownership and Institution Ownership print as bare numbers and the page does not state their unit.
- The age of the data. The page loads once and the profile fields are not live. Description text, headcount, and share counts can lag a recent change, and the price badge is a separate read.
- The dashes. A dash means the profile has no value for that row, not that the value is zero. Some companies have more of them than others.
- The labels. Group, Gind, and Gsubind are terse labels and the page does not define them. Use the values to place the company, and do not read anything into the label wording.
- The classification. Two providers can file the same company under different industries. Confirm peers by business, not only by the row.
- The ticker. Search the exact ticker. An unknown symbol can leave a mostly empty table with dashes.
Who uses the company profile
New-name researchers
Read the Description, Sector, and Industry to learn what an unfamiliar ticker actually does.
Peer comparers
Confirm two stocks share a Sector and Industry before you set their numbers side by side.
Liquidity checkers
Compare Float Share with Shares Outstanding to see how many shares are free to trade.
Options traders
Check the size and listing of the underlying before you open its option chain.