
Learn Center
Greek Gods Dashboard
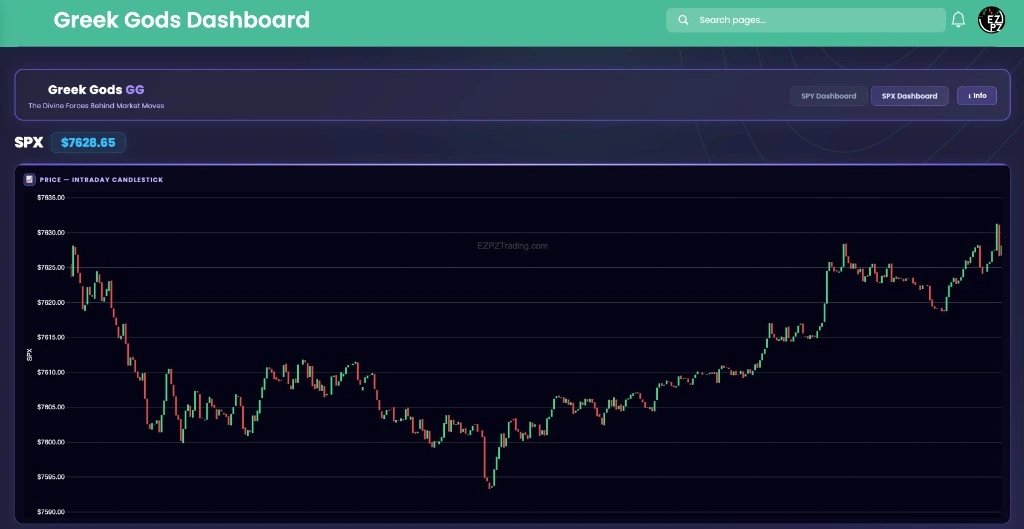
An intraday SPY or SPX view of Ares, Hermes, Apollo, and Zeus stacked under Price, Intraday Candlestick.
What is the Greek Gods Dashboard?
The Greek Gods Dashboard is an intraday SPY or SPX view of four named charts: Ares Battle Momentum (Cumulative Delta), Hermes Flow Pulse (Cumulative Gamma), Apollo Prophecy (IV Skew), and Zeus Market Power (Aggregate Signal). On EZPZ it sits under Greek Gods GG. Switch SPY Dashboard or SPX Dashboard. It is not a trade ticket.
Price, Intraday Candlestick is the underlying path for the tab you loaded. Ares is the Battle Momentum card, labeled Cumulative Delta. The page says it shows raw buying versus selling pressure, who holds the field, not who is loudest. Hermes is Flow Pulse, labeled Cumulative Gamma. The page says it is about dealer hedging, rapid adjustments, and volatility shock absorption. Apollo is Prophecy, labeled IV Skew. The page says it shows forecasted turbulence, hidden fear or calm. Zeus is Market Power, labeled Aggregate Signal. The page says it is a single metric that rules the rest. Green bars lean toward demand, calmer action, or aligned strength. Red bars lean toward supply, shaky action, or fear. Red to Green and Green to Red are color flips on those same cards. A green Ares next to a red Hermes is still two clocks. None of those colors is a fill.
On EZPZ, the live page title is Greek Gods GG. The subtitle is The Divine Forces Behind Market Moves. Tabs are SPY Dashboard and SPX Dashboard. Info opens Greek Gods Reference, Signal Interpretation Guide. The ticker strip prints SPY or SPX plus last price. The screenshot uses SPX at $7628.65. Charts stack as Price, Ares, Hermes, Apollo, then Zeus. The gods grid under the charts is Ares, Hermes, Apollo, and Zeus. AiPe in the corner is labeled Greek Gods Analyst. Theta Farming is the universe scanner with Fit Score. Theta Performance tracks Seller P&L % on one ticker. Custom Strategies is the payoff builder. Volatility Risk Premium (VRP) is implied versus later realized. Directional Options Pressure is Short Straddle, Short Strangle (Δ20), Directional Pressure, and Net Volume. Contract Prices (XVWAP) is Price candles against XVWAP on one strike. Greeks is Call and Put Delta, Theta, IV, Vega, and Gamma by strike. GEX and DEX is the Intraday GEX and DEX pair with Gamma Flip. Spot Gamma and Delta is ($) Open Interest versus ($) Volume. Option Chain is the listed book. Gamma Short Squeeze is Squeeze Score(%) ranks.
How Greek Gods works on EZPZ
Open SPY Dashboard or SPX Dashboard, then start at Price, Intraday Candlestick. It is not a score. Most people read Ares next to Hermes. If those two disagree, read Apollo and Zeus before you treat one color as the session. Open Info if you want The Four Divine Forces again. Do not treat SPX as a default thesis.
How this differs from Directional Options Pressure
Directional Options Pressure is one ticker you search. Chart View plots Short Straddle Price / 2, Short Strangle (Δ20), Directional Pressure, and Net Volume. This page is locked to SPY Dashboard or SPX Dashboard. The four god charts are Cumulative Delta, Cumulative Gamma, IV Skew, and Aggregate Signal. Use Directional Options Pressure when you want Straddle Profit % next to Direction. Use this page when you want Ares next to Hermes on SPY or SPX. Use Theta Farming when you want Fit Score across many names. Use Theta Performance when you want Seller P&L % or Payoff at Expiration. Use Custom Strategies when you want a payoff diagram you assemble. Use Volatility Risk Premium (VRP) when you want OVERVALUED IV or UNDERVALUED IV. Use Greeks when you want Call Delta Distribution by strike. That page is a chain snapshot, not these four session paths. Use GEX and DEX when you want Gamma Flip. Use Spot Gamma and Delta when you want ($) Open Interest versus ($) Volume. Use Option Chain when you want listed strikes.
Header, tabs, and Price
The header is the name of the page. The tabs pick the index. You do not need every chart on every session.
These controls sit on Greek Gods GG. They are not a screenshot strip. Documented from the live labels.
| Control | What you are looking at |
|---|---|
| Greek Gods GG | The page title. The subtitle is The Divine Forces Behind Market Moves. |
| SPY Dashboard SPX Dashboard | The only two index tabs. SPY Dashboard starts on. The screenshot has SPX loaded at $7628.65. |
| Info | Opens Greek Gods Reference, Signal Interpretation Guide. The first section is The Four Divine Forces. |
| SPY SPX | The ticker strip. Last price sits in the blue badge next to the name. |
The first card is the underlying path for the tab you picked.
| On the chart | What you are looking at |
|---|---|
| Price, Intraday Candlestick | Session candles for SPY or SPX. The Y axis on the screenshot is labeled SPX. |
| Last price | The badge under the header. The screenshot prints $7628.65. |
Ares and Hermes
These two cards sit under Price. Ares is Battle Momentum (Cumulative Delta). Hermes is Flow Pulse (Cumulative Gamma). Green bars sit above zero. Red bars sit below zero. A line rides the same path.

| Chart | What the page prints |
|---|---|
| Ares, Battle Momentum (Cumulative Delta) | God of War. Embodies raw buying versus selling pressure. Reveals who truly holds the field, not just who is loudest. |
| Hermes, Flow Pulse (Cumulative Gamma) | God of Trade and Speed. Symbolizes dealer hedging, rapid adjustments, and volatility shock absorption. Spot hidden pressure before it shows up in price. |
| Color on Ares | What the Ares card says |
|---|---|
| Green | Warriors of demand are pushing forward. |
| Red | Supply forces taking control of the field. |
| Red to Green | Buyers rallying to reclaim dominance. |
| Green to Red | Weakening conviction or an ambush. |
| Color on Hermes | What the Hermes card says |
|---|---|
| Green | Price action is more stable and calm. |
| Red | Markets are shaky and could swing fast. |
| Red to Green | Signs of balance returning. |
| Green to Red | Warning: volatility ahead. |
Apollo and Zeus
These two cards sit under Hermes. Apollo is Prophecy (IV Skew). Zeus is Market Power (Aggregate Signal). The gods grid and Info repeat the same color lines.
| Chart | What the page prints |
|---|---|
| Apollo, Prophecy (IV Skew) | God of Foresight. Reveals the market's forecasted turbulence. Shines a light on hidden fears or calm. Shows if the market expects peace or storms. |
| Zeus, Market Power (Aggregate Signal) | King of the Gods. Commands all others, representing total directional power and market balance. A single, powerful metric that rules the rest. |
| Color on Apollo | What the Apollo card says |
|---|---|
| Green | Calm skies, fear is low. |
| Red | Tension building, fear is rising. |
| Red to Green | Nerves easing, risk appetite returning. |
| Green to Red | Caution: fear may drive fast moves. |
| Color on Zeus | What the Zeus card says |
|---|---|
| Green | Strength across the board, all gods align. |
| Red | Weakness, sellers, hedgers, and fear dominate. |
| Red to Green | Power shift in favor of bulls. |
| Green to Red | Watch out, tides may turn. |
How people actually use it
Pick SPY or SPX
Leave SPY Dashboard on, or switch to SPX Dashboard. Confirm the ticker strip and last price before you read Ares.
Read Price, then Ares
Start at Price, Intraday Candlestick. Then look at Battle Momentum (Cumulative Delta). Green demand against a falling candle path is still two clocks.
Check Hermes against Ares
Hermes is Flow Pulse (Cumulative Gamma). A green Ares next to a red Hermes is a split, not a fill.
Finish with Apollo and Zeus
Apollo is IV Skew. Zeus is Aggregate Signal. Open Info only if you want The Four Divine Forces again.