
Learn Center
Price Target
Where Wall Street analysts expect a stock's price to go, summarized as a High, Low, Mean, and Median across the analysts covering it.
What is an analyst price target and how do you read it?
An analyst price target is the price a Wall Street analyst expects a stock to reach over a set horizon. Because many analysts cover one large stock, the price target page rolls their targets into a High, a Low, a Mean, and a Median, plus the number of analysts behind them. On EZPZ you load a ticker and see those four levels drawn forward from today's price.
Read the four levels as a range of opinion, not a forecast. The Median is the middle analyst, the Mean is the average and gets pulled by extreme targets, and the High and Low mark the most bullish and most bearish views on the list. Compare each one with the current price to see the implied move, then look at how wide the range is. A tight range means analysts broadly agree. A wide range means the stock has a real debate around it. The page also keeps every earlier snapshot in a table, so you can check whether the consensus has been rising or falling. Two limits matter. A target is one analyst's opinion over the analyst's own horizon, and targets are revised on each firm's own schedule, so they often trail the price. The page does not show which firm set which target or the reasoning behind it.
How the Price Target page works on EZPZ
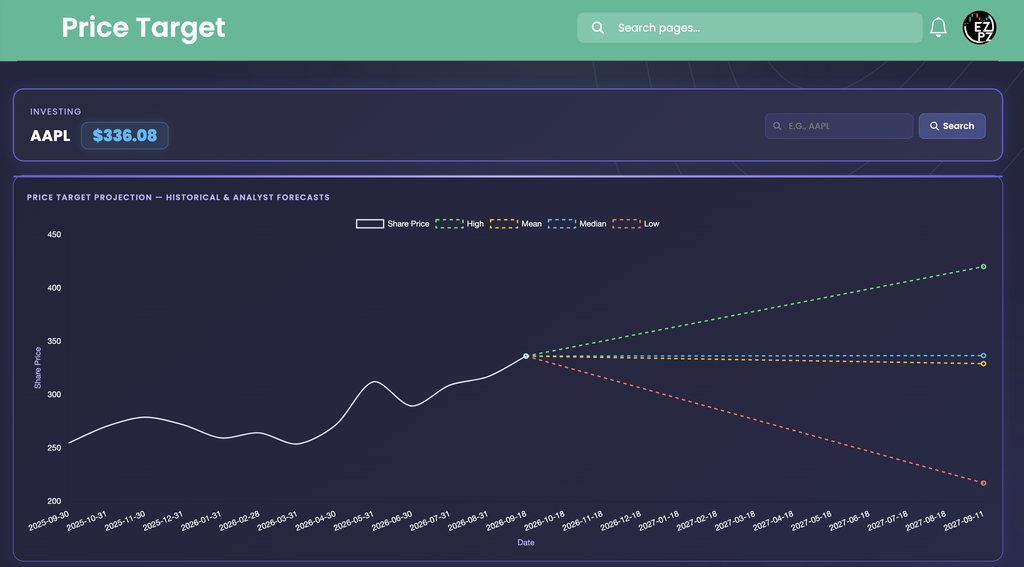
The page opens on AAPL. The header card shows the ticker and a blue price badge, such as AAPL $336.08. On the right, type a symbol into the search box and click Search, or press Enter, to load another stock. The box uppercases what you type. If a ticker has no price, the badge hides but the rest of the page still loads. The page loads once per search and does not refresh on its own.
Below the header, the page stacks two blocks: the projection chart and the Price Target Data table. The chart uses the newest row of the table. The table keeps the older rows.
The Price Target Projection chart
The white line is Share Price. It is drawn from monthly points over roughly the last year, so it is a coarse trace, not a daily chart, and it is smoothed between points. The four dashed lines start at the last plotted price and run to the projection date on the right edge. Each color is one target level, and the legend above the chart names them.
- Only the end dots are data. Each dashed line has two dots: the last plotted price and the target at the projection date. The straight line between them is drawn for the eye. It is not a forecast of the path the stock will take.
- The date axis is evenly spaced by label. Historical points and the future months each get an equal slot, so the chart shows shape, not exact time gaps.
- The dashed lines start at the last plotted close. That can differ slightly from the header price, which is the current market price.
- Hover for exact numbers. The tooltip lists the price or the targets at the point under your cursor. Click a legend name to hide that line.
In the capture, the white line climbs from about 250 to about 335 over the year, with a dip in March. The dashed fan ends at 2027-09-11 with High near 420, Median near 336 just above the last price, Mean near 329, and Low near 217. The fan is lopsided: the High sits far above the price and the Low sits even farther below it.
The Price Target Data table

| Column | What you are looking at |
|---|---|
| Ticker | The symbol you searched. |
| Record Date | The date of the snapshot. The table opens sorted newest first, and the gaps between rows are uneven. |
| Projection Date | The date the targets are set against. On every row in the capture it is exactly one year after the Record Date. |
| Number Analysts | How many analysts sit behind that row. It can change from one snapshot to the next. |
| Target High | The highest target, in green. |
| Target Low | The lowest target, in red. |
| Target Mean | The average target, in yellow. |
| Target Median | The middle target, in blue. |
The table has no search box. Use the page controls under it to move to older snapshots.
Reading the AAPL example
Start with the newest row, 2026-09-11. It has 43 analysts, a Target High of 420.00, a Target Low of 217.15, a Target Mean of 329.05, and a Target Median of 336.60. Against the $336.08 in the header, that is about 25.0% above the price for the High, 35.4% below for the Low, 2.1% below for the Mean, and 0.2% above for the Median. So the middle of the analyst crowd sits almost exactly on the price, the most bullish analyst sees a quarter more upside, and the most bearish sees a third less.
Notice that the Mean is below the Median. The High is 83.40 above the Median and the Low is 119.45 below it, so the lone low target drags the average down. When Mean and Median disagree, look at the High and Low to see which one is doing it.
Now scroll the history. Target Low reads 217.15 on every one of the fifteen rows, so the most bearish target did not move. The High went from 341.25 on 2025-12-03 to 367.50 from 2025-12-18 through 2026-04-25, then to 420.00 from 2026-05-11 onward. Over the same rows the Mean rose from 286.45 to 329.05 and the Median from 286.61 to 336.60. The Number Analysts count moved between 43 and 48. The whole range shifted up while the bottom stayed put, which is a bullish drift in the consensus, and the price chart above shows the stock rising along with it.
How Price Target differs from nearby Investing pages
This page answers "where do analysts think the price is going, and how much do they disagree?" For the rest of the research picture, use the neighbors. Recommendation Trends counts analysts by Strong Buy, Buy, Hold, Sell, and Strong Sell, which is the rating behind a target rather than the price level itself. Upgrade and Downgrade lists individual rating changes with the firm and the date, which is the event that can move a High or Low here. Analyst Estimates and Earnings Surprises cover forward numbers and reported results, the inputs analysts use to set targets. Social Sentiment measures retail chatter, a different crowd from sell side analysts. Ticker Performance shows what the price itself did, with returns, moving averages, and 52 week ranges. Support and Resistance gives chart levels from price behavior, which is a different source of price levels than analyst opinion. Congressional Trading tracks disclosed trades by lawmakers, another outside view on a stock. Sector Metrics compares financial ratios against a sector Median, a fundamental yardstick beside the targets. Market News lists the general financial headlines that often come before a change in targets. Company Profile shows what the business does and how large it is, context for the targets above. Company News lists recent headlines for one ticker. Financial Statements shows the reported revenue, profit, debt and cash that a target is built on. For the standard fundamental ratios behind the company, Basic Financials groups valuation, profitability, growth, debt, and dividends for one ticker. Historical Market Cap charts a company's total value across a date range, which shows how the market's view of the whole company has moved. Dividends lists each cash payment per share, the income side that a price target leaves out.
Outside this category, Ticker Explorer is the one-symbol dashboard when you want a live quote and options context beside the targets you just read.
What to check before you rely on it
- Median against price. It is the least distorted single number. A Median well above the price means most analysts see upside, near the price means they see it as fairly valued.
- Mean against Median. A gap means an extreme target is pulling the average, so check the High and Low.
- Width of the range. Compare High minus Low with the price. A wide spread is a genuine debate, not a consensus.
- Number Analysts. A small count means one analyst changing a target moves every level. Read thinly covered names with care.
- Direction across rows. Look at whether High, Mean, and Median rise or fall from one Record Date to the next before you trust today's level.
- Empty results. Not every symbol has targets. If the table has no rows, there is nothing to read, and any chart still on screen may be left over from the previous ticker, so confirm the table matches the symbol in the header.
Who uses price targets
Investors sizing upside
Compare the Median and Mean with the current price to see how much room analysts think is left.
Risk checkers
Look at the Low target and the High to Low spread to see how wide the disagreement is before sizing a position.
Earnings watchers
Compare the rows before and after a report to see whether targets were raised or cut on the news.
Contrarian readers
Spot names where the price has already passed the Mean or High and ask how much of the story is priced in.