
Learn Center
Custom Strategies
A builder for constructing your own multi leg options positions and seeing the payoff, breakeven, and risk before you place the trade.
What are custom strategies?
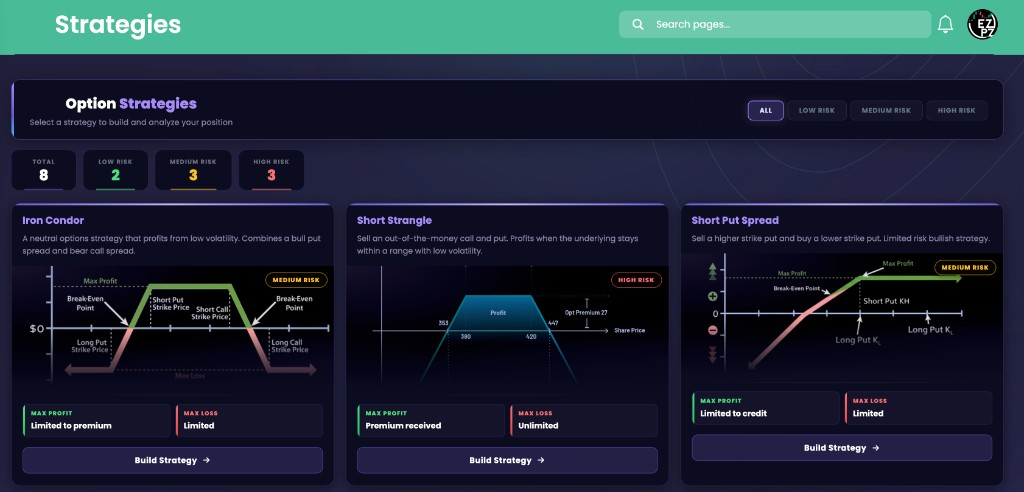
Custom Strategies is a catalog of named option structures you can model on a ticker you choose. On EZPZ the list page is Option Strategies. Each card shows a payoff sketch, Max Profit, Max Loss, and a risk badge. Build Strategy opens that structure so you can type a symbol or tap Suggested Tickers.
A named structure is a known combination of calls and puts, not a fill. Iron Condor, Short Strangle, Short Put Spread, Short Call Spread, Covered Call, and Cash-Secured Put sit on the grid with a Low Risk, Medium Risk, or High Risk badge. Short Call Spread is also called a bear call spread: sell a call closer to the current price, buy a higher-strike call for protection, and collect a net credit. Max Profit on that card is Limited to credit. Max Loss is Limited. You still pick the underlying yourself. Type a ticker in Ticker Symbol, such as AAPL for Apple, or tap a Suggested Tickers pill. Build Strategy then generates that named structure on the stock you chose. The AAPL page prints last price, Expiration, Strike Range, Strategy Metrics, and Options Greeks. A card is a template, not a trade.
On EZPZ, the live page title is Strategies. The header is Option Strategies. The subtitle is Select a strategy to build and analyze your position. Filters are All, Low Risk, Medium Risk, and High Risk. The stat row is Total, Low Risk, Medium Risk, and High Risk. Each card has Build Strategy when the structure is deployed, or View Details when it is not. The build page title is Build, then the strategy name, then Strategy, such as Build Short Call Spread Strategy. Ticker Symbol sits above the search field. Suggested Tickers sit under that card. The guide body under the search is What is a short call spread?, How it is constructed, and Key points when you opened Short Call Spread. Risk Warning sits at the bottom. AiPe on the list is labeled Strategy Guide. Theta Farming is the universe scanner with Fit Score. Theta Performance tracks Seller P&L % on one ticker. Volatility Risk Premium (VRP) is the implied versus later realized chart. Directional Options Pressure is Chart View and Table View for Short Straddle, Short Strangle (Δ20), Directional Pressure, and Net Volume. Greek Gods Dashboard is Ares, Hermes, Apollo, and Zeus on SPY Dashboard or SPX Dashboard. Contract Prices (XVWAP) is Price candles against XVWAP on one strike. IV Rank Explorer is Current IV (30D) and IV Rank (1Y) for one ticker you search. Option Chain is the listed book for one ticker. Ticker Explorer is the one-symbol dashboard after you already picked a name. Gamma Short Squeeze is Squeeze Score(%) ranks.
How Custom Strategies works on EZPZ
Start on Option Strategies, leave All on, then open a card. It is not a score you trade. Most people read Max Profit and Max Loss first, then the risk badge. Click Build Strategy on a deployed card such as Short Call Spread. Type AAPL, or another listed name, in Ticker Symbol. Press Build Strategy again. The next page is the generated Short Call Spread for that stock. Read Expiration, Strike Range, then Strategy Metrics. Open Table or Graph under P/L %. Use Search ticker and Go if you want a different name. Use All Strategies to return to the grid.
How this differs from Theta Farming
Theta Farming is a universe scan. Fit Score sits on Strategy Suggestion badges across many names. This page is a catalog you open, then a ticker you type. Use Theta Farming when you want Iron Condor or Short Call Spread next to Fit Score on a list. Use this page when you already know the structure and want to pick the symbol yourself. Theta Performance is one ticker at a time with a live Net Credit Value path. Use that page when you want Seller P&L % or Payoff at Expiration, not a Build Strategy search. Use Volatility Risk Premium (VRP) when you want OVERVALUED IV or UNDERVALUED IV next to spot candles. Use Directional Options Pressure when you want Straddle Profit % next to Directional Pressure. Use IV Rank Explorer when you want the 1Y clock. Use Option Chain when you want listed strikes. Use Ticker Explorer when you want quote, IV Rank, and unusual activity on one symbol.
Filter the catalog
The header filter bar cuts the grid by risk. All starts on. The stat pills count every card, then the Low Risk, Medium Risk, and High Risk totals. Empty copy is No strategies match this filter.
| On the page | What you are looking at |
|---|---|
| All | Every named structure on the grid. |
| Low Risk | Cards such as Covered Call and Cash-Secured Put in the screenshot. |
| Medium Risk | Cards such as Iron Condor, Short Put Spread, and Short Call Spread. |
| High Risk | Cards such as Short Strangle, where Max Loss on the card is Unlimited. |
| Total | How many cards are in the catalog. |
Read a strategy card
Each card is one named structure. The payoff sketch is a teaching diagram, not live P&L. Read the chips before you click Build Strategy.

These labels sit on every card.
| On the card | What you are looking at |
|---|---|
| Name | The structure, such as Short Call Spread or Iron Condor. |
| Description | One sentence on how the structure is built and what it is for. |
| Low Risk Medium Risk High Risk | The badge on the payoff sketch. |
| Max Profit | The cap printed on the card, such as Limited to credit or Limited to premium. |
| Max Loss | The loss cap, or Unlimited on Short Strangle. |
| Build Strategy | Opens the build page for a deployed structure. |
| View Details | Opens the same page when the structure is not deployed. Build Strategy on that page is Coming Soon. |
These names appear on the screenshot grid. Other cards can sit in the catalog.
| Name | Risk on the card | Max Profit / Max Loss |
|---|---|---|
| Iron Condor | Medium Risk | Limited to premium / Limited |
| Short Strangle | High Risk | Premium received / Unlimited |
| Short Put Spread | Medium Risk | Limited to credit / Limited |
| Short Call Spread | Medium Risk | Limited to credit / Limited |
| Covered Call | Low Risk | Premium plus upside to the strike / Large stock downside risk |
| Cash-Secured Put | Low Risk | Premium earned / Stock falls below strike, net of premium |
Build Short Call Spread by ticker
The build page is where you attach a symbol to the structure you opened. You can type the ticker yourself. You do not have to use Suggested Tickers. The header keeps the strategy name, the one-line description, the risk badge, and All Strategies.

| Control | What you are looking at |
|---|---|
| Ticker Symbol | Type the underlying you want to model. The placeholder is e.g. AAPL, SPY, TSLA. The field uppercases as you type. |
| Build Strategy | Opens the named structure on the ticker you entered. Empty input shows Please enter a ticker symbol! |
| Suggested Tickers | Pills already tagged for this structure. Each pill is a ticker plus Monthlies, Weeklies, or Intraday. Click one to skip typing. |
| All Strategies | Returns to the Option Strategies grid. |
| Coming Soon | Build Strategy is disabled when the structure is not deployed. |
What is a short call spread on this page?
After you open Short Call Spread, the guide under the search is the teaching copy for that structure. The screenshot title is What is a short call spread? The payoff chart is labeled Short Call Spread. How it is constructed and Key points sit under the chart.

How it is constructed is a numbered list on the Short Call Spread page.
| Step | What the page says |
|---|---|
| 1 | Sell a call at strike B, closer to the current price (short call). |
| 2 | Buy a call at strike C, a higher strike for protection. |
Key points is the checklist under the legs.
- Net credit strategy. Premium is received up front.
- Profits when price remains below the short call strike (B) at expiration.
- Loss if price rises above the long call strike (C).
- Works best in neutral-to-bearish markets with stable or falling volatility.
- Defined maximum risk, so the loss is capped at the long call.
What is generated after you choose AAPL?
Press Build Strategy on Apple (AAPL) and the next page is the live Short Call Spread for that stock, not the catalog card. The screenshot header is AAPL, last price, and a SHORT-CALL-SPREAD badge. Search ticker and Go sit on the right if you want to switch names. Expiration is a date strip with a days badge, such as 8d. Put Side, Strike Range, and Call Side sit under that strip. Strategy Metrics and Options Greeks sit under the legs. Table and Graph sit under the metrics. The numbers on the screenshot are one generated example. They are not a fill.

The top of the generated page is the ticker you chose.
| On the page | What you are looking at |
|---|---|
| AAPL | The underlying you typed or tapped. Last price sits next to it. |
| SHORT-CALL-SPREAD | The named structure you opened from the catalog. |
| Search ticker Go | Load the same structure on a different symbol. |
| Expiration | Listed expirations as month groups and day pills. The days badge, such as 8d, is how many days remain on the selected date. |
Short Call Spread uses calls only. Put Side can print No put legs for this strategy.
| On the page | What you are looking at |
|---|---|
| Put Side | Empty on Short Call Spread. The copy is No put legs for this strategy. |
| Strike Range | The visualizer for the selected calls versus last price. The screenshot marks AAPL on the bar with Buy Call and Sell Call strikes. |
| Call Side | The two call legs. Buy Call and Sell Call each print Last, Qty, Total, and a strike select. Qty starts at 10. |
Strategy Metrics is the generated P&L band for the legs on screen. Options Greeks sit under it.
| Label | What you are looking at |
|---|---|
| Net Credit | Premium collected on the structure at the current marks. |
| Max Profit | The profit cap on this generated spread. |
| Max Loss | The loss cap on this generated spread. |
| Chance of Profit | The percent printed for the current legs and expiration. It is a model reading, not a guarantee. |
| Breakevens | Where the structure stops making money. Short Call Spread can print Above a price, as on the AAPL screenshot. |
| Delta Gamma Theta Vega Epsilon | Options Greeks for the full structure. The row labels are Δ Delta, Γ Gamma, Θ Theta, V Vega, and ε Epsilon. |
How do you read Graph and Table?
Under Strategy Metrics, tabs are Contract Value, P/L $, and P/L %. View buttons are Table and Graph. Range and IV sliders sit on the right. P/L % starts on. Table starts on. Graph plots Today, At Expiry, and Breakeven across underlying price. Table is a heatmap of percent by price row and session column.


| Control | What you are looking at |
|---|---|
| Contract Value | Modeled value of the structure, in dollars. |
| P/L $ | Modeled profit or loss in dollars. |
| P/L % | The same path as a percent. This tab starts on. |
| Table | Heatmap by price and date. Green leans profit. Red leans loss. The current spot row is highlighted. |
| Graph | Today, At Expiry, and Breakeven versus underlying price. |
| Range | How far the price axis runs from spot, as a percent. |
| IV | Implied volatility used in the model. Moving it changes the paths, not the listed strikes. |
How people actually use it
Filter by risk first
Leave All on if you want the full grid. Switch to Medium Risk when you only want defined-risk cards such as Short Call Spread.
Open one structure
Read Max Profit and Max Loss on the card, then click Build Strategy. Short Strangle still shows Unlimited on Max Loss.
Type your own ticker
Enter AAPL for Apple, or SPY, TSLA, or any listed name in Ticker Symbol. Press Build Strategy. The next page generates that structure on the stock you chose.
Or tap a suggested name
Suggested Tickers already carry Monthlies, Weeklies, or Intraday. Use a pill when you want that timeframe shortcut, then still size the trade yourself.
Read the generated AAPL page
On Apple, start at Expiration and Call Side, then Net Credit, Max Profit, Max Loss, Chance of Profit, and Breakevens. Open Graph or Table under P/L %.