
Learn Center
Economic Calendar
A live list of scheduled economic releases by country, with each result beside its forecast and prior reading.
What is the Economic Calendar and how do you read it?
The Economic Calendar is a live list of scheduled economic releases, grouped by country, with each event's result beside what forecasters expected and what the last release printed. On EZPZ it is a single full-height panel: pick the countries and importance levels you care about, then read each row as Actual, Forecast, and Prior.
The whole idea is comparison. A number on its own says little. A reading of 6.33% for Russian year over year CPI means something only when you can see it against a 6.3% forecast and a 5.98% prior reading. Markets tend to price in the forecast before the release, so the gap between Actual and Forecast, called the surprise, is usually what moves prices. The gap between Actual and Prior tells you which way the trend is turning. The calendar is a planning tool. It shows what is scheduled and what just printed. It does not say how any price will react, and it is not a signal.
How the Economic Calendar works on EZPZ
The list is an embedded TradingView events widget, the same TradingView logo you see in the bottom right corner of the panel. EZPZ does not compute or edit the rows. The page frames the widget in dark mode at full width and a fixed 800 pixel height, in English, so a long list scrolls inside the panel instead of stretching the page. The widget is loaded with all three importance levels turned on, low, medium, and high, so the list is busier than a high impact only calendar.
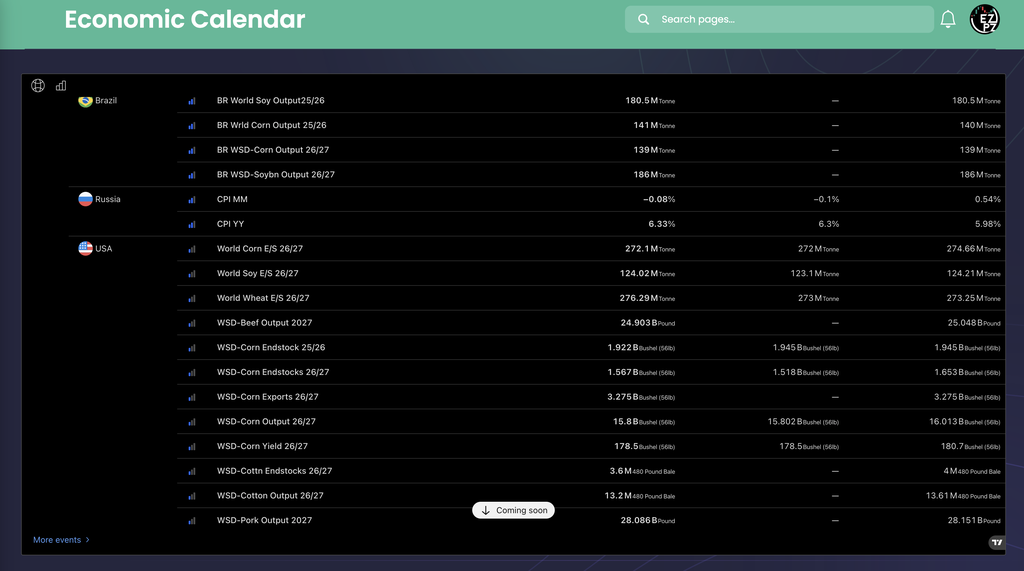
The parts of the panel
| Part | What you are looking at |
|---|---|
| Globe icon | Top left of the panel. It is the widget's country control, used to choose which countries' events appear. |
| Bar chart icon | Next to the globe. It is the widget's importance control, used to include or drop low, medium, and high importance events. |
| Country group | A flag and country name (Brazil, Russia, USA in the capture) printed once, with that country's events stacked under it. |
| Importance bars | A small bar icon at the start of each row. The more bars filled, the higher the importance the widget gives the event. |
| Event name | The release's title, such as CPI MM, CPI YY, or World Wheat E/S 26/27. |
| Actual | The first value column, printed in bold. It is the number that was released. |
| Forecast | The middle column, in lighter type. It is the expected number. A dash means no forecast was supplied. |
| Prior | The right column. It is the previous release of the same event, the number to compare the trend against. |
| Coming soon | A button with a down arrow floating over the bottom of the list. Judging by its label, it moves you toward events that have not printed yet. |
| More events | A blue link at the bottom left of the widget that opens a fuller calendar at the source. |
The capture shows no heading row above the three value columns and no date or time headings, so read left to right as Actual, Forecast, Prior. The widget prints each number with its unit after it, such as % or M Tonne, so check the unit before you compare two rows.
Reading the capture
The capture shows 18 events: 4 under Brazil, 2 under Russia, and 12 under USA. It is a slice of the list, and it happens to hold agricultural supply estimates and Russian CPI rather than the marquee US releases. What you see on your screen depends on where the panel is scrolled and which countries and importance levels are on.
Here is how the three columns work on rows you can read in the capture.
| Event | Actual | Forecast | Prior | Read |
|---|---|---|---|---|
| Russia CPI YY | 6.33% | 6.3% | 5.98% | 0.03 points above forecast and 0.35 points above the prior reading. |
| Russia CPI MM | -0.08% | -0.1% | 0.54% | 0.02 points above forecast, but 0.62 points below the prior month. |
| WSD-Corn Endstocks 26/27 | 1.567 B Bushel (56lb) | 1.518 B | 1.653 B | 0.049 B above forecast, 0.086 B below prior. |
| WSD-Corn Yield 26/27 | 178.5 Bushel (56lb) | 178.5 | 180.7 | Exactly on forecast, 2.2 below prior. |
| World Wheat E/S 26/27 | 276.29 M Tonne | 273 M | 273.25 M | 3.29 M above forecast and 3.04 M above prior. |
The two Russia CPI rows show why you read both comparisons. Year over year CPI came in a touch above forecast and well above the prior reading, so the yearly rate rose. Month over month CPI also beat its forecast slightly, yet it fell from 0.54% to -0.08%, so prices rose more slowly than the month before. Same country, same day, two different stories. Whether an above forecast number is good or bad depends on the event, since higher CPI and higher stocks in storage mean very different things.
Rows with a dash in the middle column, such as WSD-Cotton Output 26/27 (13.2 M 480 Pound Bale against 13.61 M prior), have no forecast in the widget. For those you only have Actual against Prior, so there is no surprise to measure.
Event names come from the feed and the page does not define them. The WSD prefix and labels like 26/27 are not explained on the page, so if you are unsure what a release measures, look it up before you rely on it.
How to use the calendar in a trading day
- Narrow it first. Use the globe icon to keep only the countries you trade, and the bar chart icon to drop low importance rows if the list feels like noise.
- Check the unit. A % row and an M Tonne row are not comparable. Read the unit printed after each number.
- Compare in two steps. Actual against Forecast is the surprise. Actual against Prior is the direction of travel.
- Look ahead. Use the Coming soon button or scroll down to see what is still to print before you open a position you plan to hold through it.
- Then check price. A release is only interesting if it moved something. Open the chart or the options data for the name you trade and see what actually happened.
How the Economic Calendar differs from nearby pages
This page is a schedule of when data lands and how it compared with expectations. The other Calendars pages track different kinds of dates. Earnings Calendar lists when companies report, IPO Calendar lists new listings, FDA Calendar lists drug decision dates, Market Holidays lists days the exchanges are closed, and Schedule lists EZPZ's own live sessions in your time zone, not market events. Options traders often pair the calendar with Expected Move, IV Rank Explorer, and Volatility Analysis to see how much the options market is pricing around an event. Ticker Explorer is the one symbol view for checking a name after a release.
What to check before you rely on it
- The source. The rows are TradingView's, not EZPZ's. EZPZ does not add, correct, or time stamp them.
- Blank Forecast. A dash means there was nothing to compare with, not that the forecast was zero.
- Revisions. Statistics agencies sometimes revise a number after it prints, so a Prior value can differ from what you saw the first time.
- The unit and the period. Month over month and year over year rows share a name. Read the suffix (MM, YY) and any crop year label before you compare.
- Importance is the widget's judgement. A low bar count does not mean a release cannot move a related market, so match it to what you actually trade.
Who uses an economic calendar
Day traders
Check what prints before the open and mid session so a release does not catch a position by surprise.
Options traders
Look for known events that sit inside an expiration, since implied volatility often builds into a release and drops after it.
Swing and position traders
Decide whether to hold through a big print or trim ahead of it, using the Coming soon end of the list.
Global and commodity watchers
Use the globe icon to follow other countries' inflation and crop supply releases, like the Brazil and USA rows in the capture.