
Learn Center
Unusual Activity Intraday
Watch large, sweep, and block options trades as the session develops, with date and total value filters.
What is unusual activity intraday?
Unusual activity intraday is a live scan of large, sweep, and block options trades as the session develops. Each row is one flagged print: the contract, size, premium, and order tag. The list can change as volume builds. Size still does not tell you who traded or why.
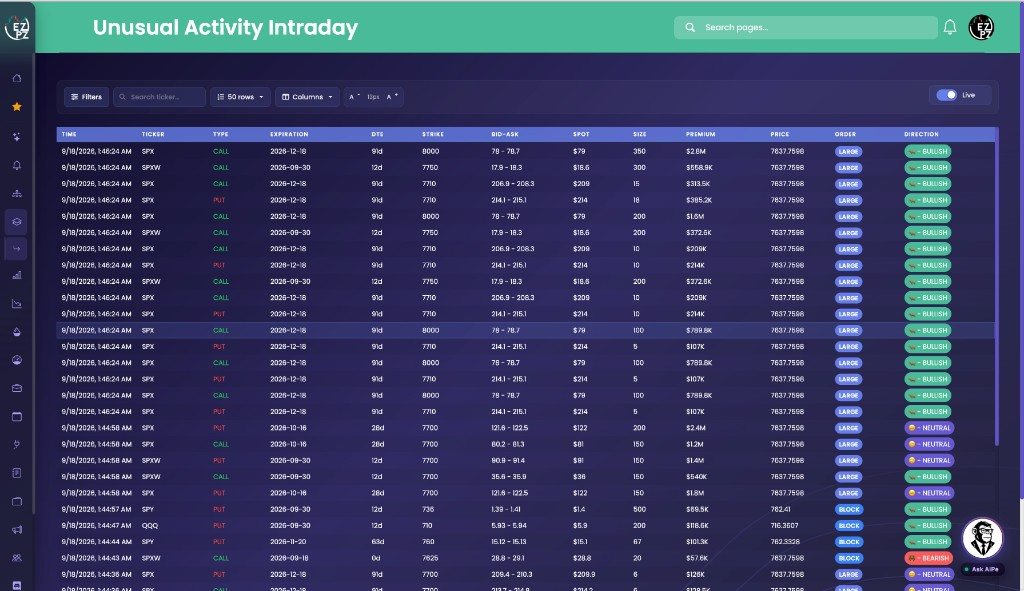
Read a row left to right. TIME and TICKER tell you when it printed and on which name. TYPE is CALL or PUT. STRIKE, EXPIRATION, and DTE tell you which contract. SIZE and PREMIUM tell you whether enough capital moved to care. ORDER is Large, Sweep, or Block. DIRECTION is the bullish, bearish, or neutral label on the row. None of those tags are a thesis. A sweep usually means the order was split across venues to get filled now. A block is a large, negotiated print. Large is size without those other tags. Repeated flags on the same ticker in a short window are usually a stronger prompt than a single row. Hedges, spread legs, and market-maker activity show up here too. Treat a flag as a reason to look at the chart and nearby flow, not as an order to follow.
On EZPZ, Unusual Activity Intraday is that session feed. The filter drawer is titled Intraday Filters. You can bound the list with Start Date and End Date, pick a Sentiment or Activity Type, and set a Total Value floor. Unusual Activity is the same Large, Sweep, and Block idea with toggle filters and no date range. Live Flow is every matching print. $1M Plus Flow keeps only prints that already clear a million dollars of premium. 0DTE Flow keeps only prints that expire today. SPX and SPY Flow locks the tape to SPX, SPXW, and SPY. Option Chain is the contract book for one ticker, not the tape.
How Unusual Activity Intraday works on EZPZ
Each row is one flagged trade: large, sweep, or block, with the contract, the size, the premium, and the tags that describe how it hit. Use this page when you want standouts as the session moves, or when you need a date window on that same list. Start with ticker search, then Intraday Filters if the table is too loud.
How this differs from Unusual Activity
Unusual Activity uses toggle filters and has no date range. This page uses dropdowns plus Start Date and End Date. Activity Type is All, Large, Sweep, or Block, one choice at a time. There is no separate calls and puts toggle. Use Unusual Activity when you want independent toggles. Use this page when you want a date range on the same kind of rows. Open Live Flow if you want the prints around a standout. Open $1M Plus Flow if you only want million-dollar premium. Open 0DTE Flow if you only want prints that expire today. Open SPX and SPY Flow if you only care about S&P 500 positioning. Open Option Chain if you want the listed strikes for one ticker.
Anatomy of a row
Read left to right: when it printed, what contract it was, then how it was classified. You do not need every column on every row. Use the tabs if you want a map of the fields.
These columns answer what printed, and when.
| Column | What you are looking at |
|---|---|
| TIME | When the trade printed. |
| TICKER | The underlying. Search this in the toolbar or in Intraday Filters if you only care about one name. |
| TYPE | CALL or PUT. Calls show green. Puts show red. |
| STRIKE | The strike that traded. |
| EXPIRATION DTE | Expiration date and days left. A small DTE is a short-dated view. A large DTE is further out. A 0 here is usually same-day activity. |
These columns help you decide if the trade is large enough to spend time on.
| Column | What you are looking at |
|---|---|
| SIZE | How large the print is. Read it next to premium, not by itself. |
| PREMIUM | Dollar premium. This is the fastest way to rank the list. Raise Total Value in Filters if cheap contracts are drowning it. |
| BID-ASK | The quoted spread at the print. |
| SPOT | The compact dollar figure on the row. |
| PRICE | The underlying price at the print. Index names show the index level here. |
ORDER and DIRECTION describe the print. They do not tell you why the trader did it.
| Column | What you are looking at |
|---|---|
| ORDER | How the trade was classified: LARGE, SWEEP, or BLOCK. |
| DIRECTION | Bullish, bearish, or neutral label on the row. |
Filter the session
Click Filters in the toolbar. The drawer header says Intraday Filters. That is how you cut the list down to a ticker, a sentiment, one activity type, a date window, or a total value screen. Apply Filters runs the screen. Reset in the header, or Reset All at the bottom, clears it.

Dropdowns
- Sentiment: All, Bullish, Bearish, or Neutral. One choice at a time.
- Activity Type: All, Large, Sweep, or Block. One choice at a time. Leave All on if you want every tagged row.
Dates and value
- Search ticker: Limit the feed to one underlying. The same search also lives in the toolbar, and the two stay in sync.
- Start Date and End Date: Bound the list to a window. Leave both empty to watch the live session.
- Total Value: Min and max. Leave a field empty and there is no cap on that side (shown as infinity).
On the toolbar you can also change how many rows you see (50 is the common setting, up to 300), which columns are visible, and the text size with A- / A+ (13px is the starting size).
Stay live
The right side of the toolbar is a single switch:
- Live: newer matching trades can show up during market hours.
- Paused: the list freezes so a row does not scroll away while you read it.
There is no Prev / Next on this page. If you pause, you are sitting with the rows already on screen.
How people actually use it
Watch the session
Leave ticker search empty. Leave Start Date and End Date empty. Keep Live on beside a chart. You are listening for standouts as they print.
Watch one name
Type a ticker in Search ticker. The toolbar and Intraday Filters stay in sync. You are listening for that name, not the whole market.
Hunt one activity type
Set Activity Type to Sweep or to Block. Raise Total Value if you only want the expensive ones. You cannot leave Sweep and Block on together here. That is a single dropdown.
Use it next to the other lists
This page is the session feed with a date range. Open Unusual Activity for toggle filters on the same kind of rows. Open Live Flow if a flagged trade makes you want the prints around it.