
Learn Center
Contract Prices (XVWAP)
Volume weighted average price applied to an individual options contract, giving traders an intraday reference point similar to how VWAP is used on stocks.
What is options contract XVWAP?
Options contract XVWAP is volume weighted average price on one listed option, not on the stock. On EZPZ, Contract Prices (XVWAP) charts that contract's Price candles against XVWAP. Type Call or Put, pick Strike and Expiration, then Go. It is not a trade ticket.
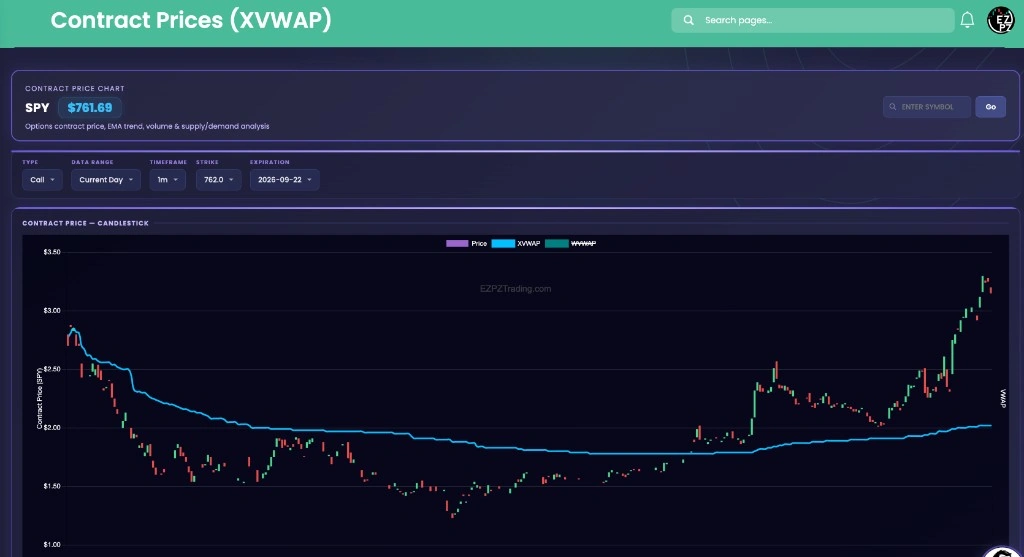
A stock VWAP weights each print by size, then averages those prices across the session. XVWAP does the same math on one option: that strike, that expiration, Call or Put. Price above XVWAP means the latest candle is trading richer than the session's volume weighted average for that contract. Price below it means the reverse. WVWAP sits on the same legend as a second line you can turn on. An option also ages, so its path can drop even when the underlying is quiet. On EZPZ the first card is Contract Price, Candlestick. The Y axis is Contract Price for the ticker you loaded. The screenshot uses SPY at $761.69, Call, Current Day, 1m, Strike 762.0, and Expiration 2026-09-22. EMA and Market Trend, Volume, and Supply and Demand sit under that card. None of those lines is a fill.
On EZPZ, the live page title is Contract Prices (XVWAP). The header label is Contract Price Chart. The subtitle is Options contract price, EMA trend, volume & supply/demand analysis. Search placeholder is Enter symbol. Go loads that ticker. Controls are Type, Data Range, Timeframe, Strike, and Expiration. Type starts on Call. Data Range starts on Current Day. Timeframe starts on 1m. Chart legend is Price, XVWAP, and WVWAP. EMA Cross Lines starts on. AiPe in the corner is labeled Contract Analyst. Theta Farming is the universe scanner with Fit Score. Theta Performance tracks Seller P&L % on one ticker. Custom Strategies is the payoff builder. Volatility Risk Premium (VRP) is implied versus later realized. Directional Options Pressure is Short Straddle, Short Strangle (Δ20), Directional Pressure, and Net Volume. Greek Gods Dashboard is Ares, Hermes, Apollo, and Zeus on SPY Dashboard or SPX Dashboard. Supply and Demand X-ray is one Price, Supply, and Demand chart per strike across the chain. Option Chain is the listed book. Ticker Explorer is the one-symbol dashboard after you already picked a name. Gamma Short Squeeze is Squeeze Score(%) ranks.
How Contract Prices works on EZPZ
Type a ticker, leave Call, Current Day, and 1m on, pick Strike and Expiration, then press Go. It is not a score. Most people start at Price versus XVWAP. If the candles sit under the cyan line, read EMA and Market Trend next. Open Volume when you want bar size on the same stamps. Scroll to Supply and Demand when you want Total Supply versus Total Demand on that contract. Do not treat SPY as a default thesis.
How this differs from Directional Options Pressure
Directional Options Pressure is one ticker with Short Straddle Price / 2, Short Strangle (Δ20), Directional Pressure, and Net Volume. This page is one contract. Price, XVWAP, and WVWAP sit on Contract Price, Candlestick. Use Directional Options Pressure when you want Straddle Profit % next to Direction. Use this page when you want that strike's candles versus XVWAP. Use Theta Farming when you want Fit Score across many names. Use Theta Performance when you want Seller P&L % or Payoff at Expiration. Use Custom Strategies when you want a payoff diagram you assemble. Use Volatility Risk Premium (VRP) when you want OVERVALUED IV or UNDERVALUED IV. Use Greek Gods Dashboard when you want Ares next to Hermes on SPY or SPX. Use Supply and Demand X-ray when you want Call on the left and Put on the right across many strikes. This page keeps Supply and Demand on the one contract you already picked. Use Option Chain when you want listed LAST, VOLUME, and OI. Use Ticker Explorer when you want quote, IV Rank, and unusual activity on one symbol.
Header and contract controls
The header is the name you loaded. The control bar picks the contract. These labels are not a screenshot strip.
Search sits on the right of Contract Price Chart. The blue badge is last price on the underlying, not the option premium.
| Control | What you are looking at |
|---|---|
| Contract Price Chart | The page label. The subtitle is Options contract price, EMA trend, volume & supply/demand analysis. |
| SPY | The ticker you loaded. The screenshot prints $761.69 next to it. |
| Enter symbol Go | Search box and load button. Type a symbol, then Go. |
Type, Data Range, Timeframe, Strike, and Expiration pick which option the four cards draw.
| Control | What you are looking at |
|---|---|
| Type | Call starts on. Put is the other pick. The screenshot uses Call. |
| Data Range | Current Day starts on. Historical is the other pick. Historical disables 1m, 5m, and 10m and moves Timeframe to 15m. |
| Timeframe | 1m, 5m, 10m, 15m, 30m, 1h. Starts on 1m. The screenshot uses 1m. |
| Strike | The listed strike for this load. The screenshot prints 762.0. |
| Expiration | The listed expiration for that contract. The screenshot prints 2026-09-22. |
Contract Price, Candlestick
The first card is the option premium path for the contract you picked. Read Price against XVWAP before you drop to EMA and Market Trend.
| On the chart | What you are looking at |
|---|---|
| Price | The candlesticks. Green is a higher close than open. Red is a lower close. The left axis is Contract Price for this ticker. |
| XVWAP | The cyan session line. The right edge of the screenshot also labels VWAP on that path. |
| WVWAP | The teal legend item next to XVWAP. Click it on the legend if you want that second line on the same axis. |
EMA and Market Trend, and Volume
These two cards sit under the candles. EMA and Market Trend plots Market Price Action Trend. The Y axis is Unit of Strength. EMA Cross Lines starts on. Volume is the bar pane under that card.

| On the cards | What you are looking at |
|---|---|
| EMA Cross Lines | Checkbox on the EMA and Market Trend header. Starts on. Turn it off if you want the path without the boxed labels. |
| EMA Cross | Boxed time labels on the path. Green marks sit on the lift. Red marks sit on the fade. The extra screenshot prints times such as 07:56 PM and 11:16 PM. |
| Volume | Contract volume on the same stamps. Green bars line up with up candles. Red bars line up with down candles. |
Supply and Demand on this contract
The last card is Supply and Demand for the same Call or Put, strike, and expiration. The left axis is Supply & Demands. The right axis is Underlying Price. The bar under the chart is Total Supply versus Total Demand, plus Prem on each side.

| On the card | What you are looking at |
|---|---|
| Price | White line. Underlying Price on the right axis. |
| Supply | Red bars. The extra screenshot prints Total Supply 3.7K and Prem $681.4K, with 52.51% on the red side of the bar. |
| Demand | Green bars. The extra screenshot prints Total Demand 3.4K and Prem $616.3K, with 47.49% on the green side of the bar. |
How people actually use it
Lock the contract
Type the symbol, leave Call or switch to Put, pick Strike and Expiration, then Go. Confirm the blue last-price badge before you read XVWAP.
Read Price versus XVWAP
Start at Contract Price, Candlestick. Candles over the cyan line are richer than this contract's session average. Candles under it are cheaper. That is a mark, not a fill.
Check EMA Cross Lines
Drop to EMA and Market Trend with EMA Cross Lines on. A green EMA Cross next to a red Volume bar is a split, not an order.
Finish on Supply and Demand
Read Total Supply versus Total Demand and the Prem figures under the last card. Use Supply and Demand X-ray only if you want the rest of the chain.