
Learn Center
SPX & SPY Flow
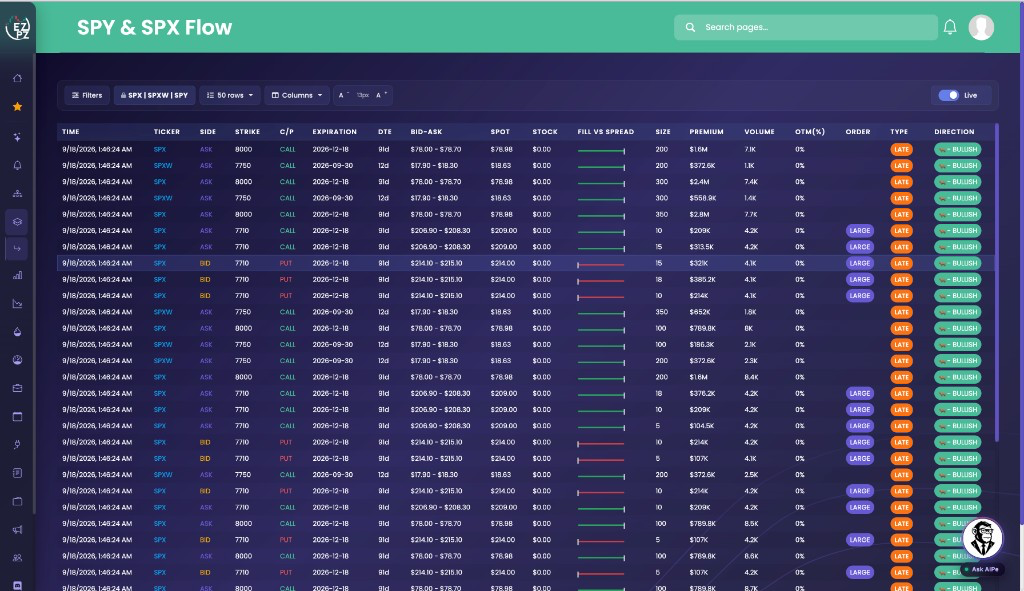
Live options tape locked to SPX, SPXW, and SPY, so you can watch how the S&P 500 is being positioned.
What is SPX and SPY options flow?
SPX and SPY options flow is the live tape of options prints on the S&P 500. SPX is the cash-settled index. SPXW is the weekly SPX contract. SPY is options on the ETF that tracks the same index. Traders watch them together because they point at the same market but attract different kinds of flow. A large SPX put is often insurance. SPY can mix retail and institutional activity on the same underlying idea.
Reading the prints is the same as any live options tape. Premium and size tell you whether enough capital moved to care. Side tells you whether the fill leaned toward the ask, the bid, or the middle. Order tags describe how it executed, not why. Short-dated flow, including same-day expiration, behaves differently from prints months out.
On EZPZ, SPX and SPY Flow is that tape with the universe already locked. There is no ticker search. Live Flow is the full market tape. Unusual Activity is large, sweep, and block prints across every name. Unusual Activity Intraday is the session scan with a date range. $1M Plus Flow keeps only prints that already clear a million dollars of premium. 0DTE Flow keeps only prints that expire today. Option Chain is the contract book for one ticker, not the tape.
How SPX and SPY Flow works on EZPZ
You only see prints on SPX, SPXW, and SPY. Each row is still one print: the contract, the size, the premium, and the tags that describe how it traded. It is not a score, and it is not a buy or sell signal. It is the index tape, so you can watch how the broad market is being positioned.
How this differs from Live Flow
Live Flow lets you search any ticker. This page cannot. The lock badge in the toolbar is the universe. Use Live Flow for a single stock. Use this page for S&P 500 positioning. Use Unusual Activity if you only want large, sweep, and block prints across every name. Use $1M Plus Flow if you only want million-dollar premium across every name. Use 0DTE Flow if you only want prints that expire today. Use Option Chain if you want the listed strikes for one ticker.
Why three tickers
They all point at the S&P 500. They do not trade the same way.
SPX
Cash-settled index options. A lot of institutional hedging lives here. A large SPX put is often insurance, not a bet that the market has to fall.
SPXW
SPX weeklies. Same index, shorter calendar. When DTE is small, this is usually the faster, more tactical slice of the same book.
SPY
Options on the ETF that tracks the same index. Mix of retail and institutional flow. Read it next to SPX, not instead of it.
Watch them together
If only one of the three is busy, that can still matter. If all three light up the same way at once, that is a broader read on the market.
Anatomy of a print
Read left to right: when it printed, which of the three tickers it was, then how it filled. You do not need every column on every print. Use the tabs if you want a map of the fields.
These columns answer what printed, and when.
| Column | What you are looking at |
|---|---|
| TIME | When the print hit the tape. |
| TICKER | SPX, SPXW, or SPY. That is the whole universe on this page. |
| SIDE | ASK, BID, or MID. That is where the fill sat versus the quote. |
| STRIKE C/P | Strike price, and whether it is a call or a put. |
| EXPIRATION DTE | Expiration date and days left. A small DTE is a short-dated view. 0 is usually same-day (0DTE) activity. |
These columns help you decide if the print is large enough to spend time on.
| Column | What you are looking at |
|---|---|
| SIZE | How many contracts printed. |
| PREMIUM | Dollar premium. This is the quickest way to rank the tape. |
| VOLUME | Volume on that contract. |
| OTM(%) | How far the strike is from the underlying, as a percent. |
| BID-ASK SPOT | The quoted spread, and the underlying price at the print. |
| FILL VS SPREAD | A bar showing where the fill landed in the spread. Green leans toward the ask. Red leans toward the bid. |
Tags describe the print. They do not score it, and they do not tell you the trader's reason.
| Column | What you are looking at |
|---|---|
| ORDER | Size markers when we have them, like LARGE. |
| TYPE | How the print was classified when we have it. LATE is common on this tape. Sweeps and other order tags can show up here too. |
| DIRECTION | Bullish, bearish, or neutral label on the row. |
Pick your columns
Click Columns in the toolbar if the table feels crowded. Uncheck anything you are not using. The list matches the table headers exactly.

A simple layout many people keep:
- Leave TIME, TICKER, SIDE, C/P, PREMIUM, TYPE, and DIRECTION on.
- Hide STOCK, BID-ASK, or FILL vs SPREAD if you only care about size and tags at first.
- Bring DTE and OTM(%) back when a row looks interesting.
On the toolbar you can also change how many rows you see (50 is a common setting, up to 500) and the text size with A- / A+.
Filter the tape
Click Filters in the toolbar. You cannot add another ticker. The drawer already says SPX | SPXW | SPY only. Use it to cut the index tape down to calls, puts, sweeps, or a premium screen. Reset puts every toggle back on and clears the ranges.

Toggles
- Option type: Calls and puts, on or off independently. Scroll up in the drawer if you do not see it yet.
- Direction: Bullish, bearish, and neutral row labels.
- Order type: Normal, Floor, Sweep, and Cross. Turn Normal off if you only want classified prints.
Ranges
- Strike, premium, volume, size, spot, DTE, OTM (%): Min and max. Leave a field empty and there is no cap on that side (shown as infinity).
Stay live
The right side of the toolbar is a single switch:
- Live: newer matching prints can show up during market hours.
- Paused: the tape freezes so a row does not scroll away while you read it.
There is no Prev / Next on this page. If you pause, you are sitting with the rows already on screen.
How people actually use it
Watch the index, not a stock
Leave the lock badge alone. Keep Live on beside an SPX or SPY chart. You are listening for the market, not a single name.
Compare the three
If SPX puts are busy and SPY is quiet, that often reads more like hedging. If both print calls at the ask, that is a broader risk-on tape.
Sit with one print
Read SIDE, C/P, DTE, PREMIUM, TYPE, and DIRECTION. Then check whether the other two tickers are doing the same thing.
Use it next to Live Flow
This page is the index slice. Live Flow is the full tape. Open Unusual Activity if you only want the standouts across every name.