
Learn Center
Weighted Alpha
A live leaderboard of the highest Weighted Alpha momentum scores, with price, volume and 52 week context beside each reading.
What is Weighted Alpha and how do you read the leaderboard?
Weighted Alpha is a momentum score that leans harder on recent price action than on older price action. A high positive number means a stock has been trending up with recent strength behind it, and a negative number means the lean is down. The EZPZ Weighted Alpha page ranks stocks by that score, highest first, and shows price, volume and 52 week context beside each one.
A plain one year return treats a big move last spring the same as a big move last week. A recency-leaning score tries to separate stocks that are trending now from stocks that trended once. That makes the leaderboard a good first filter for momentum leaders, and it also explains why the score and today's move can disagree. A stock can sit near the top of the list while it is down on the day, because one red session does not cancel a trend. Read the Wtd Alpha column for the trend, then use Change, Change %, Total Vol. and the 52 week columns to judge what the stock is doing right now. The exact formula is proprietary, so this guide covers how to read the numbers, not how they are built. Treat the list as a shortlist to research, not as a list of stocks to buy.
How the Weighted Alpha page works on EZPZ
The page is one table under a title bar. The bar carries two checkboxes, Avg Vol above 1M and Price above $1, and both are on by default. The table is sorted by Wtd Alpha from high to low, shows up to 100 names, and scrolls inside its card with the header row pinned. While the market is open it reloads about once a minute. A spinner shows while it loads.
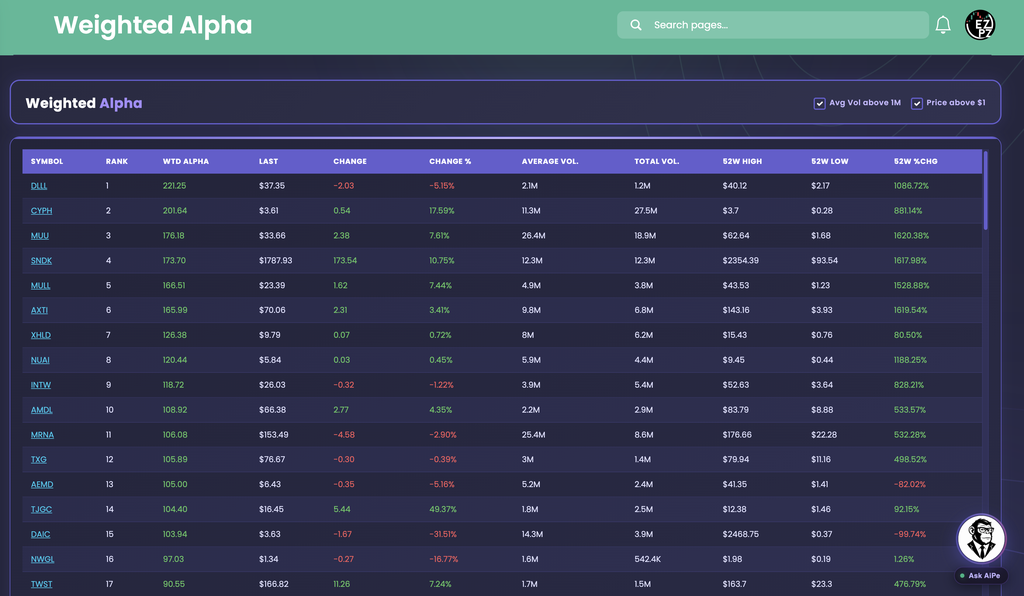
Start at the top. DLLL is Rank 1 with a Wtd Alpha of 221.25, and it is down 5.15% on the day (-2.03 to $37.35). Its Total Vol. of 1.2M is under its Average Vol. of 2.1M, so this was a quiet pullback, not a high volume selloff. CYPH is Rank 2 at 201.64 and shows the opposite day: up 17.59% (0.54 to $3.61) on 27.5M shares against an Average Vol. of 11.3M, roughly 2.4 times normal. SNDK, Rank 4 at 173.70, is up 10.75% (173.54 to $1787.93), so the score and the day agree there.
Now look for disagreement. MRNA is Rank 11 at 106.08 but down 2.90% (-4.58 to $153.49) on 8.6M shares against a 25.4M average. AEMD is Rank 13 at 105.00 and down 5.16%, and its 52W %Chg reads -82.02%. That is a good reminder that Wtd Alpha and 52W %Chg are different reads and can point opposite ways. When they do, check the chart before you trust either number. The scores also drop off fast at the top and then bunch up. Rank 1 is 221.25 and Rank 10 is 108.92, but Ranks 10 to 17 only run from 108.92 down to 90.55, so a one place difference in that stretch is small.
How Weighted Alpha differs from the rest of stocks-strategies
Weighted Alpha is a single ranked score with market context beside it. Historical Weighted Alpha is the detail page for one symbol, and every ticker in this table is a link that opens it in a new tab. Stocks Outperforming keeps four separate performance windows next to a pinned SPY row, where this page collapses trend into one number. Relative Strength (RS) Ranking turns performance into a percentile rank. Trend Trading Strategy is a members reading page on risk to reward and ATR stops, with no ticker table. Retail Trend Navigator and Market Trend Signals read trend from moving averages. Volatility Deviations looks for moves that stretched past a stock's normal range. WarriorTrading Setup is a low float day trading setup, and Peter Lynch Fundamental Screener is a valuation screen.
Nearby pages in other categories answer related questions. Top Gainers and Losers ranks one day of percent change, and Volume Leaderboard ranks trading activity. Technical Analysis reads one ticker's indicators. When a name stands out here, Ticker Explorer is the one-symbol dashboard.
Reading the columns
Read a row left to right: where it ranks and its score, what it costs and how it moved today, how busy it is, then where it sits against its 52 week range.
| Column | What you are looking at |
|---|---|
| Symbol | The ticker, shown as an underlined link. Click it to open Historical Weighted Alpha for that symbol in a new tab. |
| Rank | The row's position when all visible names are ordered by Wtd Alpha, 1 being the highest. The number stays with its row if you re-sort another column. |
| Wtd Alpha | The momentum score. Green leans bullish and red leans bearish. This is the default sort. |
| Column | What you are looking at |
|---|---|
| Last | The current price, shown with two decimals. |
| Change | The dollar move on the day, green when up and red when down. It prints as a bare number with no dollar sign. |
| Change % | The percentage move on the day, colored the same way. |
| Column | What you are looking at |
|---|---|
| Average Vol. | The stock's usual daily share volume, shown short (K, M). |
| Total Vol. | Shares traded today, shown short. Compare it with Average Vol. to see whether today is busier or quieter than normal. |
| Column | What you are looking at |
|---|---|
| 52W High 52W Low | The highest and lowest prices in the trailing 52 weeks. They print as plain numbers, so a value like $3.7 has no trailing zero. |
| 52W %Chg | The percentage change over the trailing 12 months, green above zero and red below. |
Working the table
- Avg Vol above 1M: on by default and limits the table to more liquid names. Uncheck it to reload with thinner stocks too.
- Price above $1: on by default and leaves out sub-dollar stocks. Uncheck it to include them.
- Sorting: click any column header. Rank keeps showing the Wtd Alpha position for each row, so you can sort by Total Vol. and still see where a name ranks.
- Colors: Wtd Alpha, Change, Change % and 52W %Chg are green above zero and red below. Last, volume and the 52 week high and low are white.
- Symbol links: each ticker opens its Historical Weighted Alpha page in a new tab, so you keep your place in the leaderboard.
- Ask AiPe: AiPe reads the top rows on screen and can switch the two checkboxes on or off if you ask for liquid names only or all stocks.
How people actually use it
Build a momentum shortlist
Keep both checkboxes on and scan the top of the table for names with a high Wtd Alpha. Open the ones that interest you and research them before acting.
Find a pullback in a trend
A high rank with a red Change % on light volume, like DLLL in the capture, is a strong trend having a quiet down day, not necessarily a broken one.
Spot momentum showing up today
A high rank with a green Change % and Total Vol. well above Average Vol., like CYPH, shows the trend running with real participation today.
Cross-check the 52 week story
Compare Wtd Alpha with 52W %Chg and where Last sits in the 52 week range. When they disagree, look at the chart before you trust either number.