
Learn Center
Peter Lynch Fundamental Screener
A growth at a reasonable price screen that keeps stocks passing six fixed fundamental cutoffs and shows their trend and volume beside them.
What is the Peter Lynch Fundamental Screener and how do you read it?
The Peter Lynch Fundamental Screener is a table of stocks that pass six fixed cutoffs: Trailing P/E under 25, Forward P/E under 15, Debt/Equity under 35, EPS Growth above 15, PEG Ratio under 1.2 and Market Cap above $5 billion. EZPZ puts each survivor's price, trend and average volume beside those numbers.
The idea behind it is growth at a reasonable price. Peter Lynch, the former Fidelity Magellan manager, argued that a fast-growing company can still be a poor buy if its price has run far ahead of its earnings, and the PEG Ratio is the number most associated with that idea. The cutoffs on this page are EZPZ's fixed screen built around those principles, so treat them as a filter, not as rules Lynch published. Every row already passed all six, which means the cutoffs do not separate one row from another. What separates them is how far inside each cutoff a stock sits, and what the trend columns say. Read the valuation columns first, then check the 200Day EMA, % 200Day EMA and 52W %Chg columns to see whether the market agrees with the fundamentals. It is a shortlist for research, not a list of buys.
How the Peter Lynch Fundamental Screener works on EZPZ
The page is a header card above one purple-framed table. The header card has two checkboxes, both checked when the page opens, and an info button that opens a Column Breakdown of the cutoffs. The table has thirteen columns and no paging, so the list scrolls inside its frame. It loads when you open the page and again each time you toggle a checkbox. A spinner shows while it loads, and it does not refresh on its own, so reload the page if you leave the tab open for a while. Pro members can open the page.
The two header checkboxes are the only filters you control:
Everything else is fixed. The cutoffs in the info button's Column Breakdown are the same for every viewer, and the table shows at most 100 rows.
| Cutoff | What it keeps |
|---|---|
| Trailing P/E | Under 25. The price paid for past earnings, so a lower number means less is being paid for profits already reported. |
| Forward P/E | Under 15. The price against expected future earnings. |
| Debt/Equity | Under 35. The page uses it as a stability check, since lower debt is less risky when conditions turn. |
| EPS Growth | Above 15. The page reads it as earnings momentum. |
| PEG Ratio | Under 1.2. The page describes it as balancing valuation against growth, a fair or cheap price for expected growth. |
| Market Cap | Above $5 billion, so the list leans toward established companies. |
The 200Day EMA, % 200Day EMA, 52W %Chg and Avg. Vol. columns carry no cutoff of their own. They are context, except that the Avg Vol above 1M checkbox limits the list to stocks averaging more than one million shares. Turn it off and the table keeps any stock with an average volume above zero.
What the capture shows
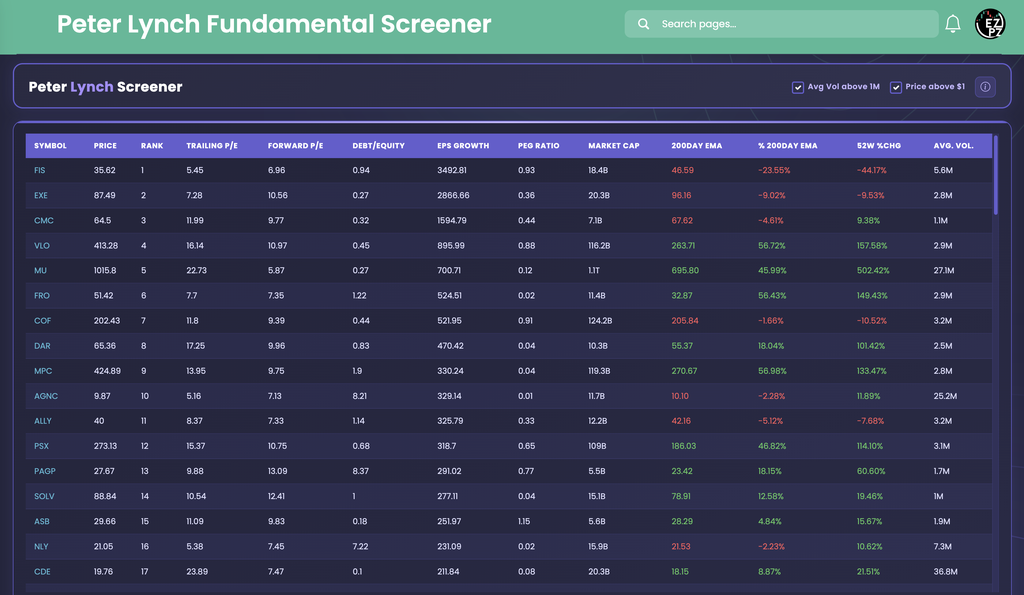
Rank is the row's position when the list is ordered by EPS Growth, highest first. In the capture, EPS Growth reads 3492.81 for FIS at Rank 1, 2866.66 for EXE at Rank 2, then 1594.79, 895.99 and 700.71 down to MU at Rank 5, and it keeps falling from there. So Rank 1 is the biggest EPS Growth number on the list, not the best-scoring stock. A very large EPS Growth figure can come from a small starting base, so check the earnings history before you treat it as a quality signal.
Now compare rows that passed the same screen and look nothing alike. FIS (Rank 1) is $35.62 against a 200Day EMA of 46.59, which is 23.55% below it, and its 52W %Chg is -44.17%. MU (Rank 5) is $1015.8 against a 200Day EMA of 695.80, which is 45.99% above it, with a 52W %Chg of 502.42% and a Market Cap of 1.1T. VLO (Rank 4) sits between them at 56.72% above its EMA with a 52W %Chg of 157.58%. The fundamentals cleared the same bar, but the market has treated these stocks very differently.
Debt/Equity and PEG Ratio vary too. AGNC (Rank 10), PAGP (Rank 13) and NLY (Rank 16) read 8.21, 8.37 and 7.22 on Debt/Equity, far above EXE at 0.27 or CDE at 0.1, yet all are under the cutoff. On PEG Ratio, ASB (Rank 15) reads 1.15, close to the 1.2 limit, while FRO (Rank 6) reads 0.02. A stock that barely passes on one column is a different case from one that clears it by a wide margin.
How the Peter Lynch Fundamental Screener differs from the rest of stocks-strategies
This page is a fundamental valuation screen, and it is the only one in Stocks Strategies that filters on P/E, debt and earnings growth. Market Trend Signals labels each stock by trend and Retail Trend Navigator draws that trend on a chart. Weighted Alpha ranks stocks by a single momentum score and Historical Weighted Alpha charts that score for one ticker over time. Stocks Outperforming keeps four performance windows beside a pinned SPY row, and Relative Strength (RS) Ranking turns performance into a percentile rank against SPY. Volatility Deviations ranks moves that stretched past a stock's normal range. Trend Trading Strategy is a members reading page on risk to reward and ATR stops, and WarriorTrading Setup is a low float day trading setup.
Nearby pages in other categories answer related questions. Volume Leaderboard ranks trading activity and Top Gainers and Losers ranks one day of percent change. Technical Analysis reads one ticker's indicators, and Ticker Explorer is the next stop for a one-symbol dashboard.
Reading the columns
Read left to right: the ticker, the price and Rank, the six screened numbers, then the trend and volume columns.
| Column | What you are looking at |
|---|---|
| Symbol | The ticker, in blue. It is plain text, not a link. |
| Price | The current price, printed as stored, so you may see 40 or 9.87 with no trailing zero. |
| Rank | The row's position by EPS Growth, highest first, numbered from 1. It is fixed to each row, so re-sorting another column does not renumber it. The table opens sorted by Rank, low to high. |
| Trailing P/E Forward P/E | The price paid for past and for expected earnings. Both are under their cutoffs on every row. The capture has rows where Forward P/E is lower than Trailing P/E (MU at 22.73 and 5.87) and rows where it is higher (PAGP at 9.88 and 13.09). |
| Debt/Equity | The debt load against equity. Lower is the stability the page is looking for. |
| EPS Growth | Earnings growth, printed as a bare number with no percent sign. It is the column Rank follows, and the values can run into the thousands. |
| PEG Ratio | Valuation against growth. Under 1.2 on every row. |
| Market Cap | Company size, shortened to a compact figure such as 18.4B or 1.1T. |
| Column | What you are looking at |
|---|---|
| 200Day EMA | The 200-day exponential moving average, with two decimals. Green when the price is above it and red when the price is below it. |
| % 200Day EMA | How far the price is from that average, with a percent sign. Green at zero or above and red below zero. A dash means the EMA is missing. |
| 52W %Chg | The stock's change over the past year, with a percent sign. Green at zero or above and red below zero. |
| Avg. Vol. | Average trading volume, shortened to a compact figure such as 5.6M. It is a liquidity check, and with Avg Vol above 1M on, every row is above one million. |
Working the page
- Avg Vol above 1M: on by default. Turn it off and the list widens to stocks with any average volume above zero. The table reloads right away.
- Price above $1: on by default. Turn it off to include stocks priced at or below a dollar. It reloads right away, and you can toggle both together.
- Info button: the circled i at the right of the header card opens the Column Breakdown that lists the cutoffs.
- Sorting: the table opens sorted by Rank, lowest first. There is no paging and no search box, so scroll the frame to see all rows, up to 100.
- Empty table: if nothing passes, or the data request fails, the table comes back empty and the spinner stops.
- No filters beyond the checkboxes: you cannot change the cutoffs, so use the columns to compare rows yourself.
How people actually use it
Build a research shortlist
Start from the rows that clear every cutoff, then keep the ones whose trend columns are green. MU and VLO in the capture are above their 200Day EMA and up over the year.
Find beaten-down names
Look for red % 200Day EMA and 52W %Chg values on a stock that still passes the screen. FIS in the capture is the example. It needs a reason, so check what changed.
Compare leverage
Read Debt/Equity across rows. A stock at 8.21 and a stock at 0.1 both pass, but they carry very different balance sheets.
Check liquidity first
Keep Avg Vol above 1M on when you want names you can trade easily, and read Avg. Vol. on each row.