
Learn Center
Stocks Outperforming
A screener for stocks beating the broader market across multiple lookback periods, a simple way to see where relative strength is showing up.
How do you tell which stocks are outperforming SPY?
A stock is outperforming SPY when its price return over a window beats what SPY returned over the same window. The EZPZ Stocks Outperforming page pins SPY on the first row and lines every other stock up under it across four windows, 7 Day, 2 Week, 3 Month and 6 Month, so you can compare each name against the market at a glance.
Beating the market once is easy. Beating it in every window, and doing it smoothly, is what marks real leadership. A stock that is up 20% this week but down over three months is a bounce, not a trend, and a stock up 80% on one wild day is different from one that closed higher almost every session. That is why the page pairs the four performance windows with four statistics for the last 15 days: Days Up, Avg Return, Std Dev and Sharpe Ratio. The performance columns say how much a stock beat SPY by. The statistics say how it got there. There is no "vs SPY" column and the list is not limited to names that win every window, so the comparison is yours to make against the pinned SPY row. Use the table to build a shortlist, then check charts, news and valuation before acting on any name.
How Stocks Outperforming works on EZPZ
The page opens with a title bar that carries one checkbox, 30 Day Avg Vol above 1M, on by default. Below it sits a single table with three header groups: Ticker & Price, Price Performance (%Chg), and Average Daily Statistics for Last 15 Days. SPY is always the first row, tinted and pinned under the header, and it stays there whichever column you sort by. The default order for the other rows is Days Up from high to low, and the list shows up to 100 names plus SPY.
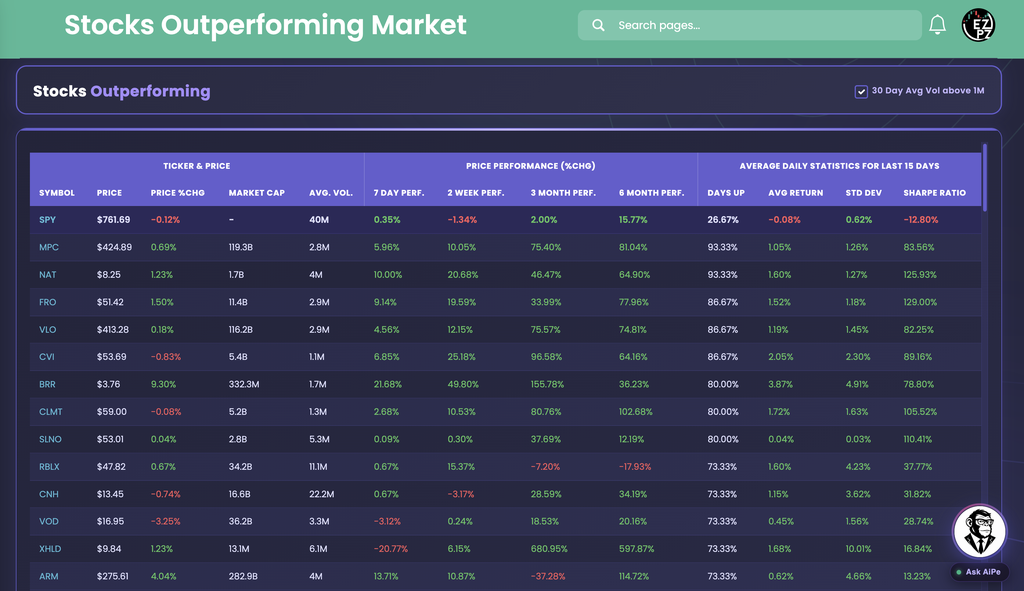
Start with the SPY row: 0.35% over 7 Day, -1.34% over 2 Week, 2.00% over 3 Month and 15.77% over 6 Month, with Days Up at 26.67%. MPC beats SPY in every window (5.96%, 10.05%, 75.40% and 81.04%), closed higher on 93.33% of the last 15 days, which is 14 of 15, and shows a Sharpe Ratio of 83.56%. NAT tells the same story with 64.90% over 6 Month, a Std Dev of just 1.27% and a Sharpe Ratio of 125.93%.
The weaker rows are as useful. RBLX beats SPY over 7 Day (0.67% against 0.35%) and 2 Week (15.37% against -1.34%), but trails over 3 Month (-7.20% against 2.00%) and 6 Month (-17.93% against 15.77%). That is a recent bounce, not durable leadership. SLNO's 6 Month return of 12.19% is under SPY's 15.77%, and its Avg Return (0.04%) and Std Dev (0.03%) are tiny, so it is a quiet stock, not a leader. XHLD posts the biggest windows on screen, 680.95% over 3 Month and 597.87% over 6 Month, but it is down 20.77% over 7 Day, its Std Dev is 10.01% and its Sharpe Ratio is only 16.84%. Compare that with NAT: a smaller 6 Month gain, much less bumpy. Also note that SPY's Market Cap cell reads "-".
How Stocks Outperforming differs from the rest of stocks-strategies
Stocks Outperforming is a live table of raw returns and consistency next to a benchmark row. Trend Trading Strategy is a members reading page on risk to reward, ATR stops and regime, with no ticker table. Relative Strength (RS) Ranking turns performance into a percentile rank, while this page shows the returns themselves. Weighted Alpha and Historical Weighted Alpha boil a year of trend into one recency weighted score, and this page keeps four separate windows. Retail Trend Navigator and Market Trend Signals read trend from moving averages. Volatility Deviations looks for moves that stretched past a stock's normal range. WarriorTrading Setup is a low float day trading setup, and Peter Lynch Fundamental Screener is a valuation screen. Here everything is price history: no news, no fundamentals, no signal label.
Nearby pages in other categories answer related questions. Top Gainers and Losers ranks one day of percent change, and Volume Leaderboard ranks trading activity. Technical Analysis reads one ticker's indicators. When a name stands out here, Ticker Explorer is the one-symbol dashboard.
Reading the columns
Read a row left to right: what the stock costs and how it moved today, how it has done over four windows, then how smooth the last 15 days were.
| Column | What you are looking at |
|---|---|
| Symbol Price | The ticker and its current price. SPY is always the first row as the benchmark. |
| Price %Chg | Today's percentage move. Green when it is up, red otherwise. |
| Market Cap | The company's market capitalization, shown short (M, B, T). It reads "-" when there is no value, as on the SPY row. |
| Avg. Vol. | Average daily trading volume over the last 15 days, shown short. |
| Column | What you are looking at |
|---|---|
| 7 Day Perf. 2 Week Perf. | Percentage price performance over the short windows. Good for spotting a recent spike or fade. |
| 3 Month Perf. 6 Month Perf. | Percentage price performance over the longer windows. Good for judging whether leadership has lasted. |
| Column | What you are looking at |
|---|---|
| Days Up | The percentage of days in the last 15 that the stock closed higher. The default sort. A high value with strong performance points to steady strength instead of one big day. |
| Avg Return | The average daily return over the period. A smoother read on typical daily performance than Price %Chg, which is only today. |
| Std Dev | How much daily returns swing. Higher means a bumpier ride. It is always green when positive, so the color is not a verdict. |
| Sharpe Ratio | A risk-adjusted read on the same period. Higher means the return came with less volatility. It carries a % sign on the page, so compare it row to row. |
Working the table
- 30 Day Avg Vol above 1M: on by default. Uncheck it to reload the table with every name, including thinner ones whose numbers can look distorted.
- Sorting: click any column header. The SPY row stays on top whichever way you sort.
- Scrolling: the table scrolls inside its card with both header rows pinned, and there are no pages. A spinner shows while the table reloads.
- Colors: Price %Chg and the four performance columns are green above zero and red otherwise. Days Up stays white.
- Ask AiPe: AiPe sees the rows on screen and can turn the checkbox on or off if you ask for liquid names only or all stocks.
How people actually use it
Measure against SPY
Keep the pinned SPY row in view and scan down each performance column. Names that sit above SPY in the same window are the ones worth a closer look.
Separate a trend from a spike
Strong 3 Month and 6 Month figures with a weaker 7 Day can be a pullback in an uptrend. Strong 7 Day with weak longer windows, like RBLX in the capture, is more likely a bounce.
Favor a smoother climb
Days Up, Std Dev and Sharpe Ratio show whether the return came steadily or in a few sharp swings. Two names with the same return can deserve very different sizing.
Keep it liquid
Leave 30 Day Avg Vol above 1M on when you want names you can actually trade. Turn it off to see smaller stocks, and treat their numbers with more caution.